. 1998 May 4;141(3):703-13.
doi: 10.1083/jcb.141.3.703.

Anaphase A chromosome movement and poleward spindle microtubule flux occur At similar rates in Xenopus extract spindles

Affiliations

Anaphase A chromosome movement and poleward spindle microtubule flux occur At similar rates in Xenopus extract spindles

A Desai et al. J Cell Biol. .

Abstract

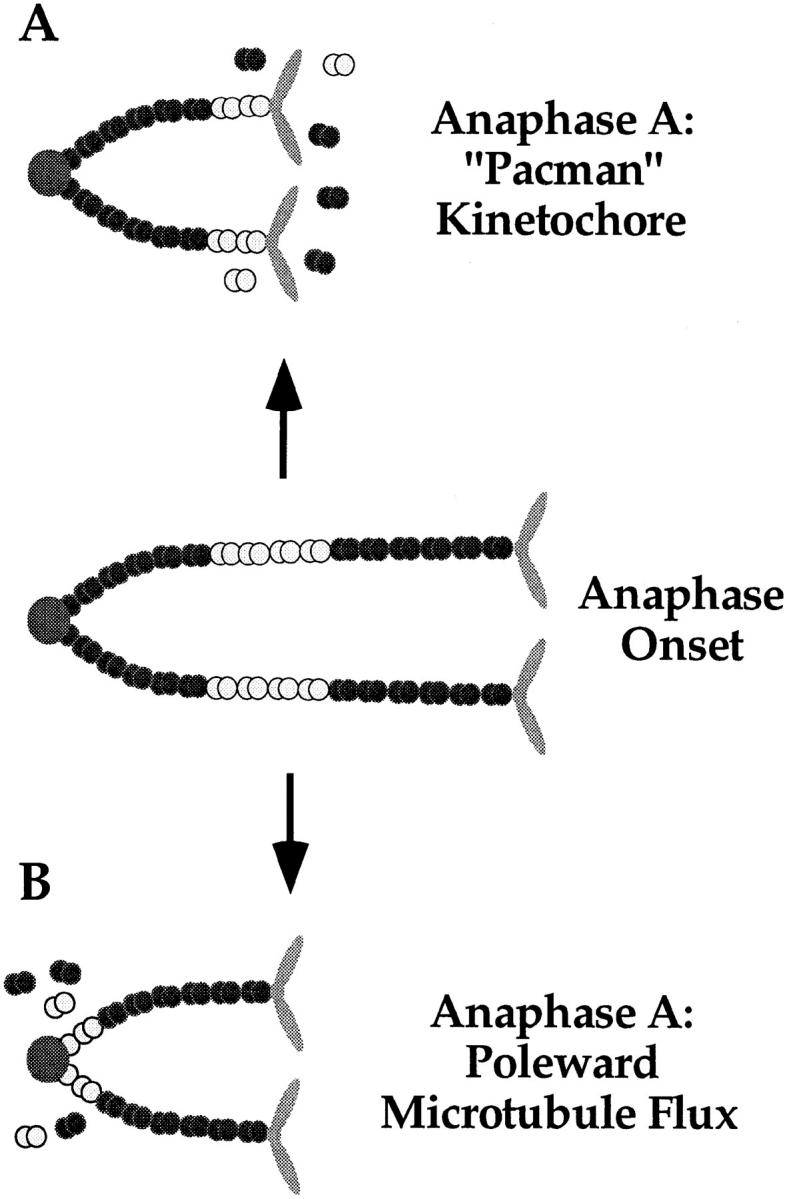
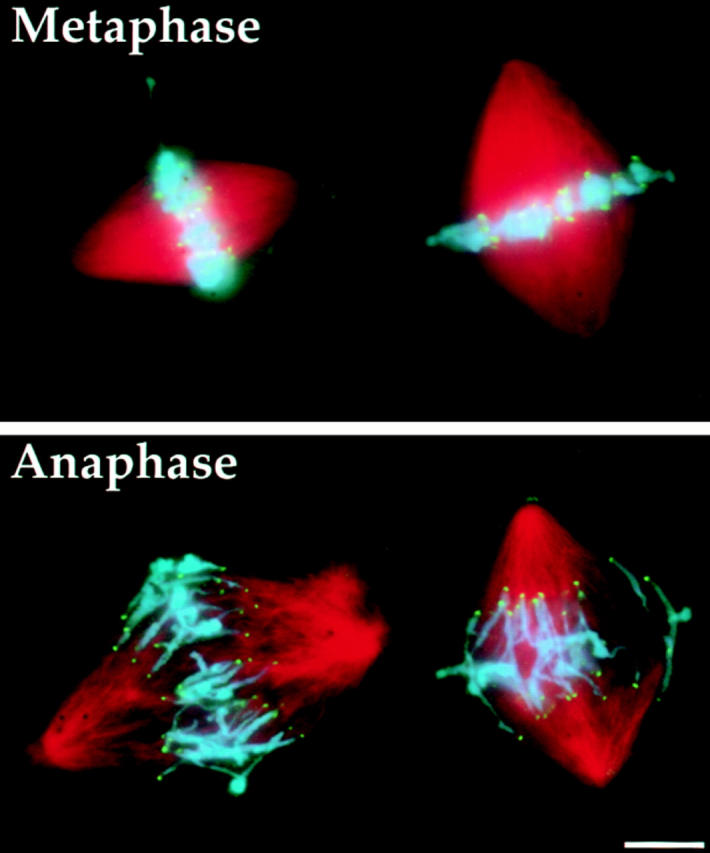
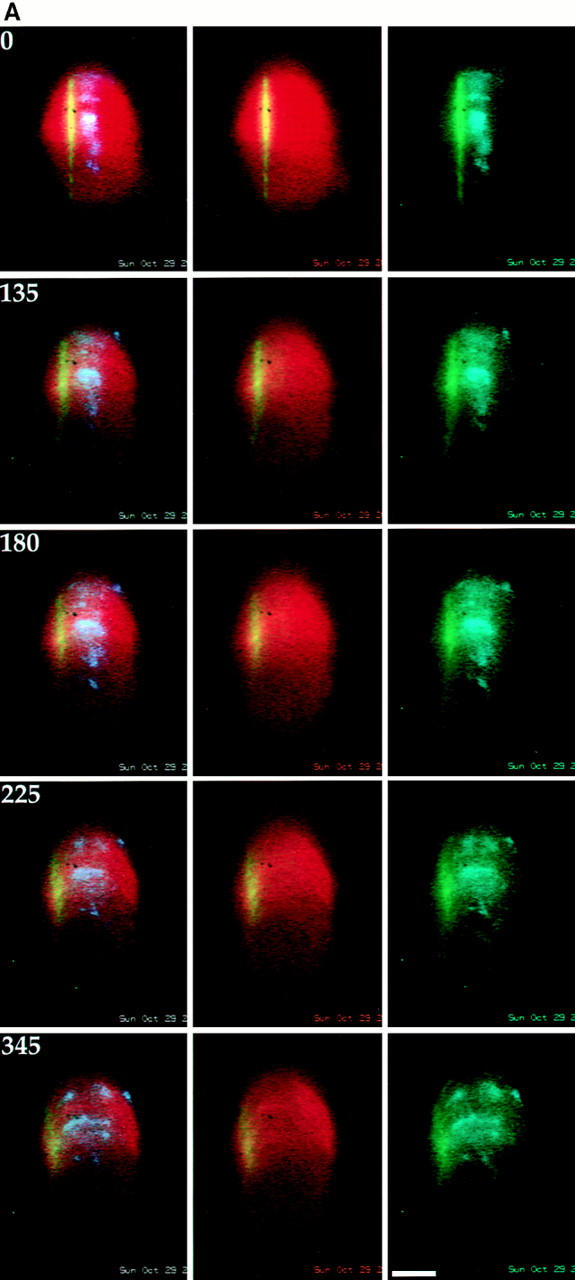
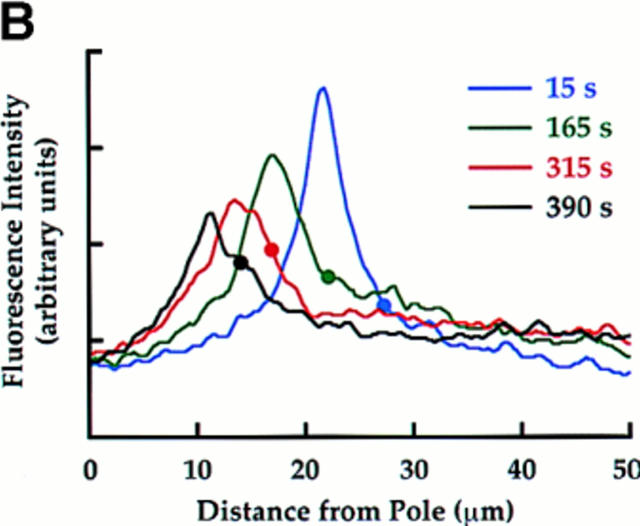
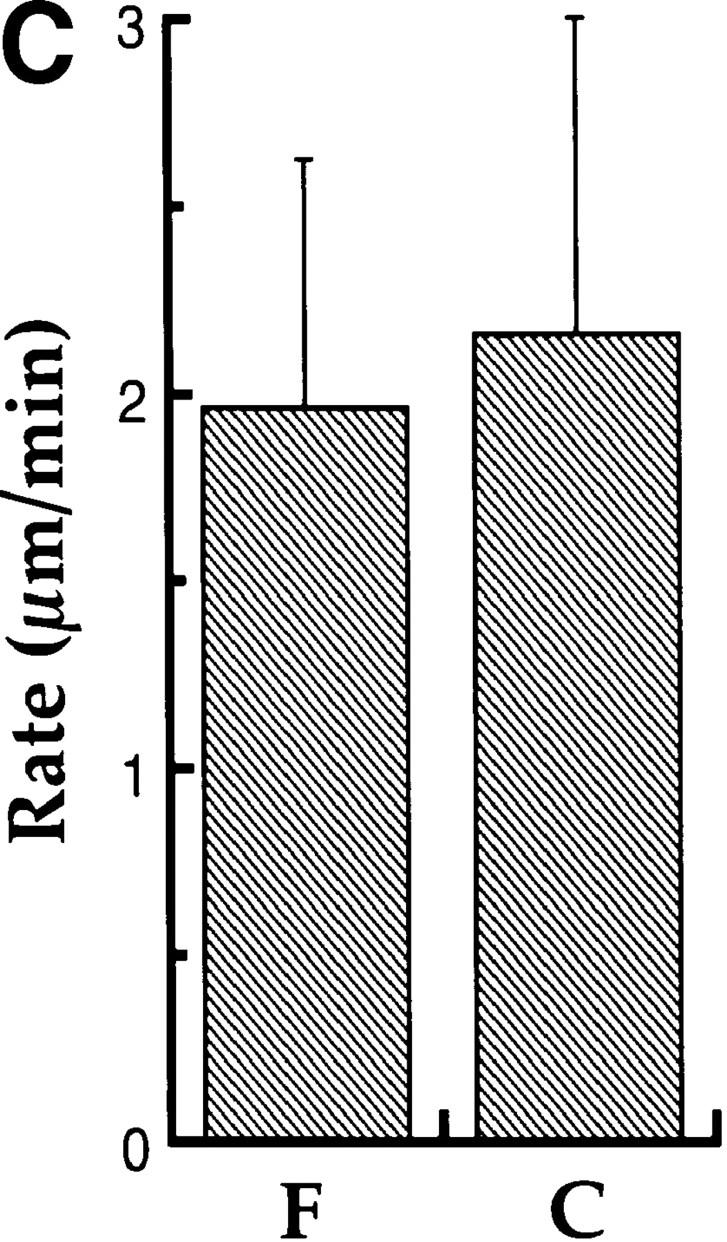
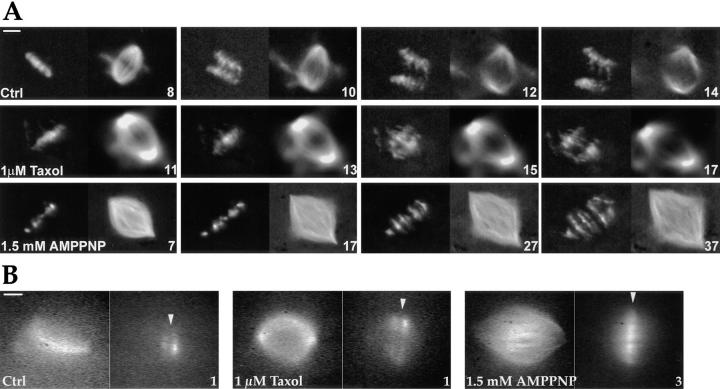
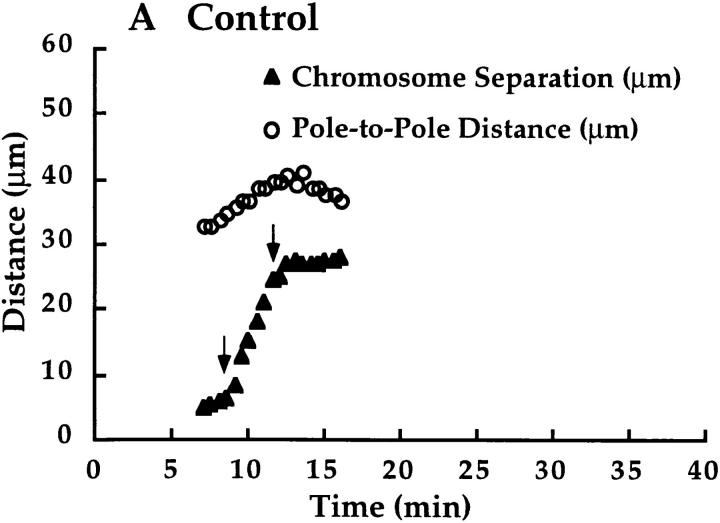
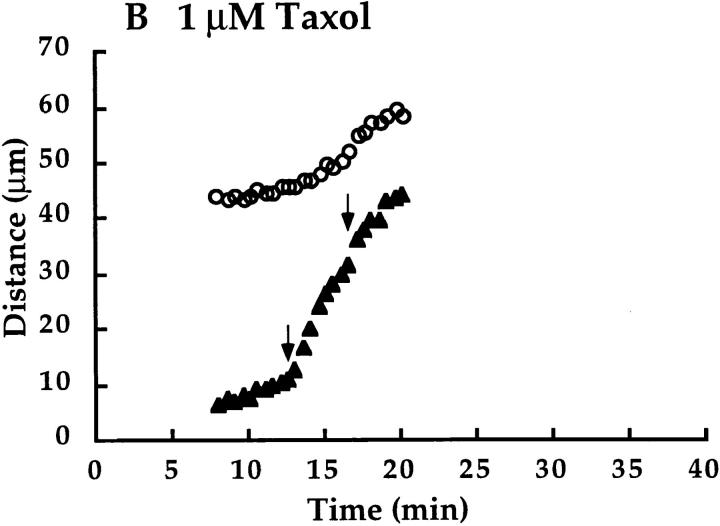
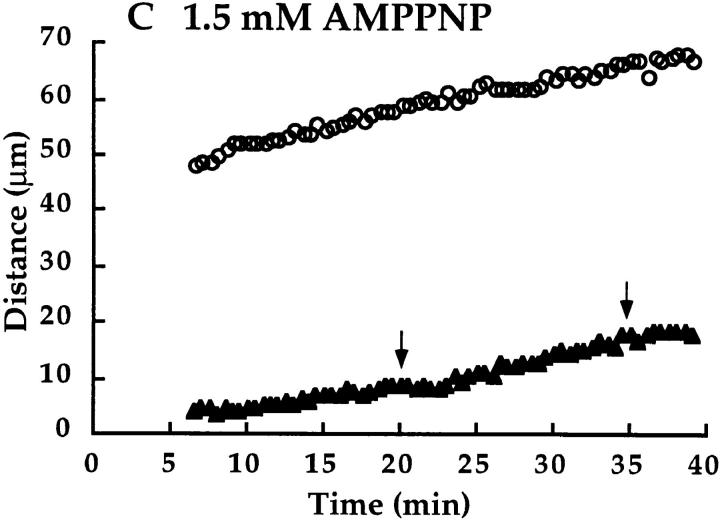
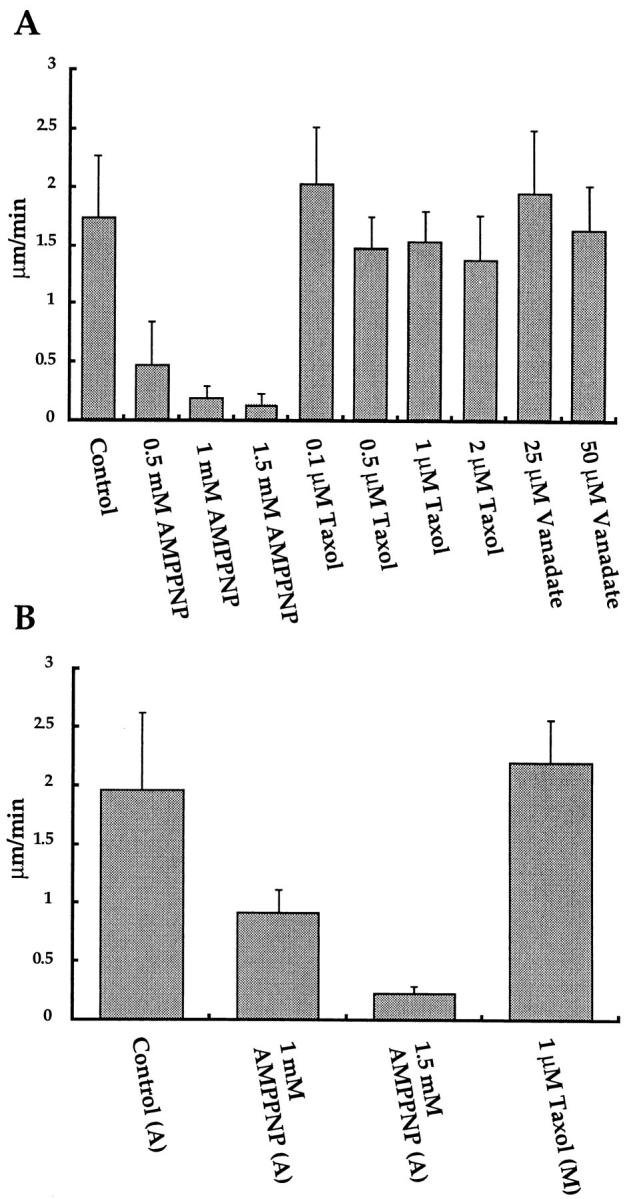
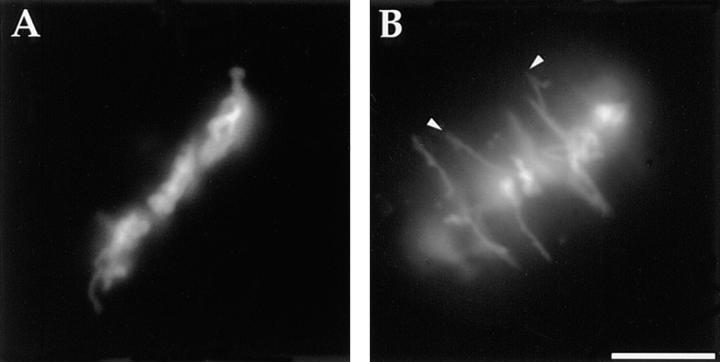
We have used local fluorescence photoactivation to mark the lattice of spindle microtubules during anaphase A in Xenopus extract spindles. We find that both poleward spindle microtubule flux and anaphase A chromosome movement occur at similar rates ( approximately 2 microm/min). This result suggests that poleward microtubule flux, coupled to microtubule depolymerization near the spindle poles, is the predominant mechanism for anaphase A in Xenopus egg extracts. In contrast, in vertebrate somatic cells a "Pacman" kinetochore mechanism, coupled to microtubule depolymerization near the kinetochore, predominates during anaphase A. Consistent with the conclusion from fluorescence photoactivation analysis, both anaphase A chromosome movement and poleward spindle microtubule flux respond similarly to pharmacological perturbations in Xenopus extracts. Furthermore, the pharmacological profile of anaphase A in Xenopus extracts differs from the previously established profile for anaphase A in vertebrate somatic cells. The difference between these profiles is consistent with poleward microtubule flux playing the predominant role in anaphase chromosome movement in Xenopus extracts, but not in vertebrate somatic cells. We discuss the possible biological implications of the existence of two distinct anaphase A mechanisms and their differential contributions to poleward chromosome movement in different cell types.


Figures

Figure 1
Figure 1
Two models for anaphase A chromosome- to-pole movement. For simplicity, only one half of the bipolar spindle and one kMT connecting the kinetochore to the spindle pole are shown. (A) “Pacman” kinetochore, kinetochores pull the chromosome poleward on relatively stationary kMTs coupled to kMT disassembly at the kinetochore. (B) Poleward Microtubule Flux (“traction fiber”), poleward flux of kMTs pulls chromosomes poleward coupled to kMT disassembly near the pole. The two models can be distinguished by making a fluorescent mark on the kMTs (indicated by the lighter subunits) between the kinetochore and the spindle pole and monitoring the behavior of the mark as the chromosomes move poleward.
Figure 2
Figure 2
Immunofluorescence micrographs of fixed spindles showing that kinetochores lead chromosomes-to-pole movement during anaphase in Xenopus extract spindles. Spindle MTs are stained red using rhodamine tubulin, chromosomes are stained blue by DAPI and CENP-E is stained green using an anti– CENP-E primary and fluorescein-labeled secondary antibodies. Metaphase-arrested bipolar spindles with replicated chromosomes contained tight metaphase plates with sister kinetochores of bivalent chromosomes localized to the equatorial region of the spindle (top). Addition of a pulse of calcium to the extract inactivated the metaphase arrest and 8 min after calcium addition separated sister chromatids were seen moving poleward (bottom). Discrete foci of CENP-E are clearly visible at the leading edges of the poleward-migrating chromosomes. Bar, 10 μm.
Figure 3
Figure 3
Simultaneous observation of chromosome movement and poleward MT flux in Xenopus extract spindles. (A) Panels from a sequence showing the similarity of poleward MT flux and chromosome movement during anaphase in Xenopus extract spindles. X-rhodamine tubulin-labeled spindle MTs are red, the photoactivated C2CF tubulin–containing MTs on the spindle MT lattice are green and the DAPI-labeled chromosomes are blue. The left column shows three-color overlays of the spindle, the mark and the chromosomes; the middle column shows two-color overlays of the fluorescent mark on the spindle MTs; and the right column shows two-color overlays of the chromosomes and the fluorescent mark. Time elapsed after the mark was made is indicated in seconds on the top left corner of the three-color overlay panels. For this particular sequence the mark was made 11 min after addition of calcium to trigger anaphase. (B) Fluorescence intensity linescan analysis of chromosome-to-pole movement and poleward MT flux during anaphase in Xenopus extract spindles. Fluorescence intensity along the spindle axis in the fluorescein channel is plotted for four different time points for the sequence in Fig. 3 A. The position of the leading edge of the chromosomes, obtained from linescans in the DAPI channel, is indicated by dots on the fluorescence intensity profiles of the mark. The left spindle pole is located at the x axis origin. The fluorescent mark, which was made close to the leading edges of the chromosomes, moved poleward and decayed in intensity, presumably as a result of spindle MT turnover. The mark also broadened as it moved, indicating the existence of differentially fluxing spindle MT subpopulations. (C) Summary of the analysis of rates of poleward MT flux (F) and chromosome-to-pole movement (C) during anaphase in Xenopus extract spindles. The plotted values represent the mean ± SD for rates measured on 11 spindles. Bar, 20 μm.
Figure 3
Figure 3
Simultaneous observation of chromosome movement and poleward MT flux in Xenopus extract spindles. (A) Panels from a sequence showing the similarity of poleward MT flux and chromosome movement during anaphase in Xenopus extract spindles. X-rhodamine tubulin-labeled spindle MTs are red, the photoactivated C2CF tubulin–containing MTs on the spindle MT lattice are green and the DAPI-labeled chromosomes are blue. The left column shows three-color overlays of the spindle, the mark and the chromosomes; the middle column shows two-color overlays of the fluorescent mark on the spindle MTs; and the right column shows two-color overlays of the chromosomes and the fluorescent mark. Time elapsed after the mark was made is indicated in seconds on the top left corner of the three-color overlay panels. For this particular sequence the mark was made 11 min after addition of calcium to trigger anaphase. (B) Fluorescence intensity linescan analysis of chromosome-to-pole movement and poleward MT flux during anaphase in Xenopus extract spindles. Fluorescence intensity along the spindle axis in the fluorescein channel is plotted for four different time points for the sequence in Fig. 3 A. The position of the leading edge of the chromosomes, obtained from linescans in the DAPI channel, is indicated by dots on the fluorescence intensity profiles of the mark. The left spindle pole is located at the x axis origin. The fluorescent mark, which was made close to the leading edges of the chromosomes, moved poleward and decayed in intensity, presumably as a result of spindle MT turnover. The mark also broadened as it moved, indicating the existence of differentially fluxing spindle MT subpopulations. (C) Summary of the analysis of rates of poleward MT flux (F) and chromosome-to-pole movement (C) during anaphase in Xenopus extract spindles. The plotted values represent the mean ± SD for rates measured on 11 spindles. Bar, 20 μm.
Figure 4
Figure 4
Pharmacological analysis of anaphase chromosome movement and poleward MT flux in Xenopus extract spindles. (A) Effect of taxol and AMPPNP treatments on chromosome movement and spindle structure during anaphase in vitro. Top row represents a control anaphase (Ctrl), the middle row represents anaphase in 1 μM taxol (1 μM Taxol), and the bottom row represents anaphase in 1.5 mM AMPPNP (1.5 mM AMPPNP). Taxol and AMPPNP were added along with the calcium used to initiate anaphase (t = 0 min). Each time point in the sequence is represented by paired DAPI-labeled chromosome (left) and X-rhodamine tubulin (right) images and the time after calcium addition is stamped in minutes on the lower right corner of the X-rhodamine tubulin image. Note both the much later times after calcium addition and the fivefold larger intervals (10 min vs. 2 min) between consecutive time points for the 1.5 mM AMPPNP sequence. The observed separation of sister chromatids in 1.5 mM AMPPNP is not due to chromosome-to-pole movement but primarily resulting from spindle elongation (see Fig. 5). (B) Effect of taxol and AMPPNP treatments on poleward MT flux. Paired X-rhodamine tubulin and fluorescein tubulin images are shown 1 min (for control and 1 μM taxol–treated spindles) and 3 min (for 1.5 mM AMPPNP–treated spindles) after the fluorescent mark was made on the spindle MTs. The initial position of the mark on the spindle is indicated by a white arrowhead. The 1 μM taxol spindle was marked 8 min after taxol addition. The 1.5 mM AMPPNP spindle was marked ∼10 min after addition of calcium and AMPPNP. Bar-splitting occurs as a result of poleward flux of MTs emanating from opposite spindle poles (Sawin and Mitchison, 1991). The similar extent of splitting of the initially central fluorescent mark is evident in both the control and taxol-treated spindles. Significant bar-splitting is not evident in the presence of 1.5 mM AMPPNP. Even at much later times (up to 10 min after marking the spindle), there is no significant bar-splitting at this AMPPNP concentration (see also Sawin and Mitchison, 1991). Bars: (A) 20 μM; (B) 10 μm.
Figure 5
Figure 5
Anaphase kinetics of chromosome separation and spindle elongation in (A) control, (B) 1 μM taxol, and (C) 1.5 mM AMPPNP. Chromosome separation was measured as the distance (in μm) between the leading edges of separating sister chromatids as described (Murray et al., 1996). The arrows mark the region used to calculate the chromosome-to-pole movement rates after subtracting out the contribution from spindle elongation. Time 0 is when calcium was added to initiate anaphase. The rapid spindle elongation after chromosome separation in 1 μM taxol and the reduction in pole-to-pole distance after chromosome separation in the control sequence occur as a consequence of cytoplasmic flows in the extract moving the separated half spindles. There is no significant chromosome-to-pole movement in 1.5 mM AMPPNP for this particular spindle. These traces are for the sequences shown in Fig. 4 A.
Figure 5
Figure 5
Anaphase kinetics of chromosome separation and spindle elongation in (A) control, (B) 1 μM taxol, and (C) 1.5 mM AMPPNP. Chromosome separation was measured as the distance (in μm) between the leading edges of separating sister chromatids as described (Murray et al., 1996). The arrows mark the region used to calculate the chromosome-to-pole movement rates after subtracting out the contribution from spindle elongation. Time 0 is when calcium was added to initiate anaphase. The rapid spindle elongation after chromosome separation in 1 μM taxol and the reduction in pole-to-pole distance after chromosome separation in the control sequence occur as a consequence of cytoplasmic flows in the extract moving the separated half spindles. There is no significant chromosome-to-pole movement in 1.5 mM AMPPNP for this particular spindle. These traces are for the sequences shown in Fig. 4 A.
Figure 6
Figure 6
Summary of the analysis of the rates of chromosome-to-pole movement (A) and poleward MT flux (B) for the indicated treatments. The anaphase poleward MT flux value is replotted from Fig. 3 C. The experiments summarized here were performed on 13 different extract preparations. For the analysis of chromosome-to-pole movement a total of 65 sequences were acquired, of which 35 were analyzed to generate the data shown in A. Each condition represents analysis of chromosome movement on three to five spindles, with the exception of 25 μM vanadate (two spindles) and 2 μM taxol (two spindles). Multiple measurements were often performed on single spindles and the observed effects were qualitatively confirmed in both sequences that were not analyzed because of extensive flow-driven movements and fixed images acquired throughout the sample preparation at the end of each sequence. The flux measurements were made for six spindles in 1 mM AMPPNP, four spindles in 1.5 mM AMPPNP, and six spindles in 1 μM taxol. The analysis of the effect of AMPPNP on flux was done on anaphase (A) spindles whereas that of taxol on flux was done on metaphase (M) spindles.
Figure 7
Figure 7
Morphology of chromosomes on Xenopus extract spindles in early metaphase arrest (A) and after a prolonged metaphase arrest (B). Arrowheads in B indicate the acrocentric centromere regions at the poleward edges of the partially disjoined chromosomes. This morphology was observed in experiments on several different extracts after a prolonged metaphase arrest. Bar, 10 μm.

Similar articles

Cited by

References

    1. Desai, A., and T.J. Mitchison. 1998. Preparation and characterization of caged fluorescein tubulin. Methods Enzymol. In press. - PubMed
    1. Desai A, Deacon HW, Walczak CE, Mitchison TJ. A method that allows the assembly of kinetochore components onto chromosomes condensed in clarified Xenopusegg extracts. Proc Nat Acad Sci USA. 1997;94:12378–12383. - PMC - PubMed
    1. Desai, A., A.W. Murray, T.J. Mitchison, and C.E. Walczak. 1998. The use of Xenopus egg extracts to study mitotic spindle assembly and function in vitro. Methods Cell Biol. In press. - PubMed
    1. Echeverri CJ, Paschal BM, Vaughan KT, Vallee RB. Molecular characterization of the 50-kD subunit of dynactin reveals function for the complex in chromosome alignment and spindle organization during mitosis. J Cell Biol. 1996;132:617–633. - PMC - PubMed
    1. Forer A. Local reduction of spindle birefringence in living Nephrotoma suturalis (Loew) spermatocytes induced by ultraviolet microbeam irradiation. J Cell Biol. 1965;25:95–117. - PMC - PubMed

Publication types