. 1998 May 4;141(3):727-39.
doi: 10.1083/jcb.141.3.727.

Absence of the mid-sized neurofilament subunit decreases axonal calibers, levels of light neurofilament (NF-L), and neurofilament content

Affiliations

Absence of the mid-sized neurofilament subunit decreases axonal calibers, levels of light neurofilament (NF-L), and neurofilament content

G A Elder et al. J Cell Biol. .

Abstract

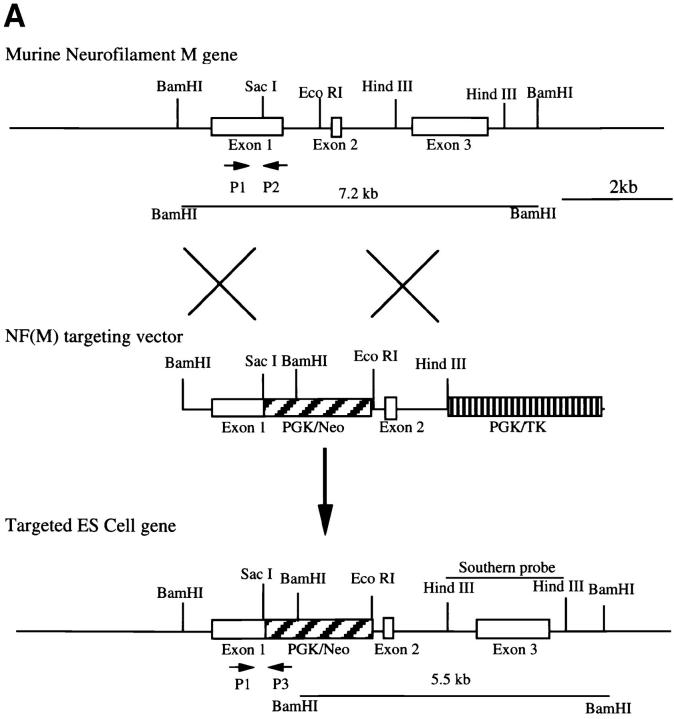
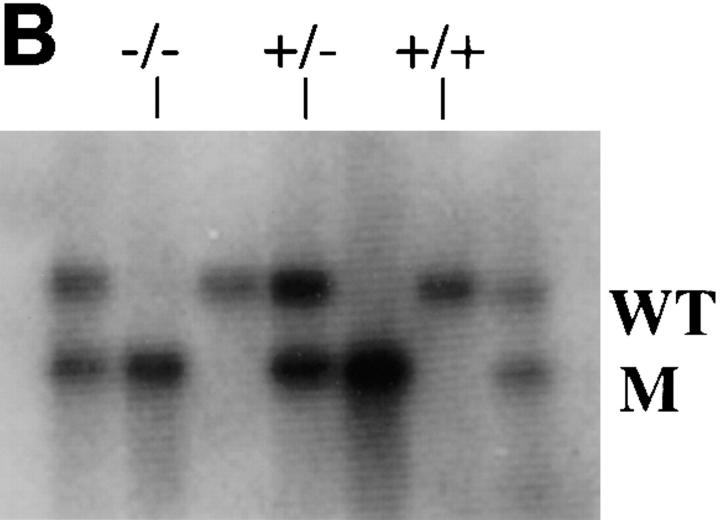
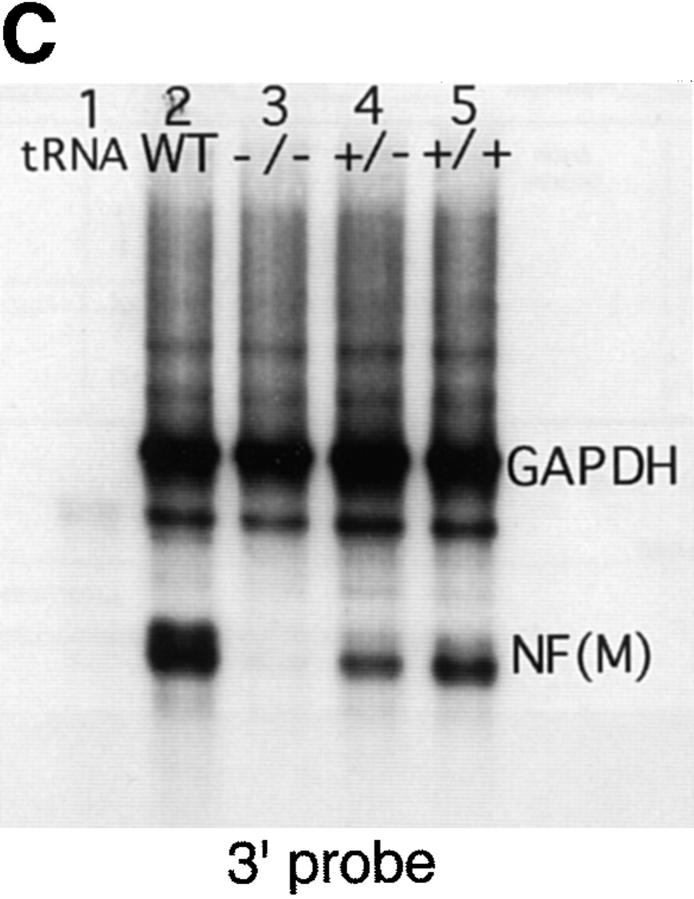
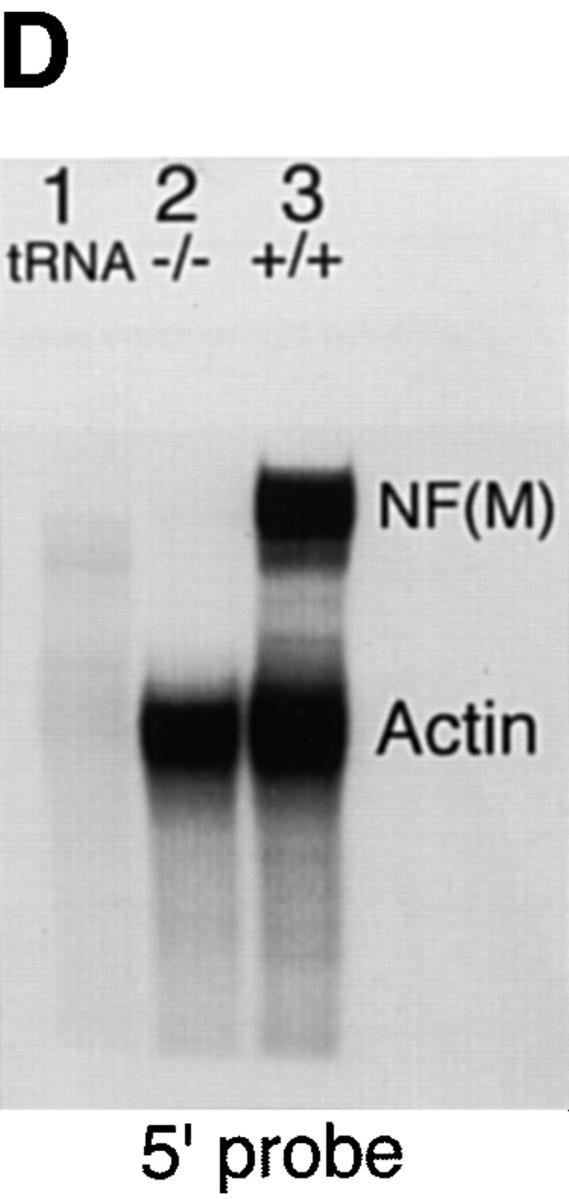
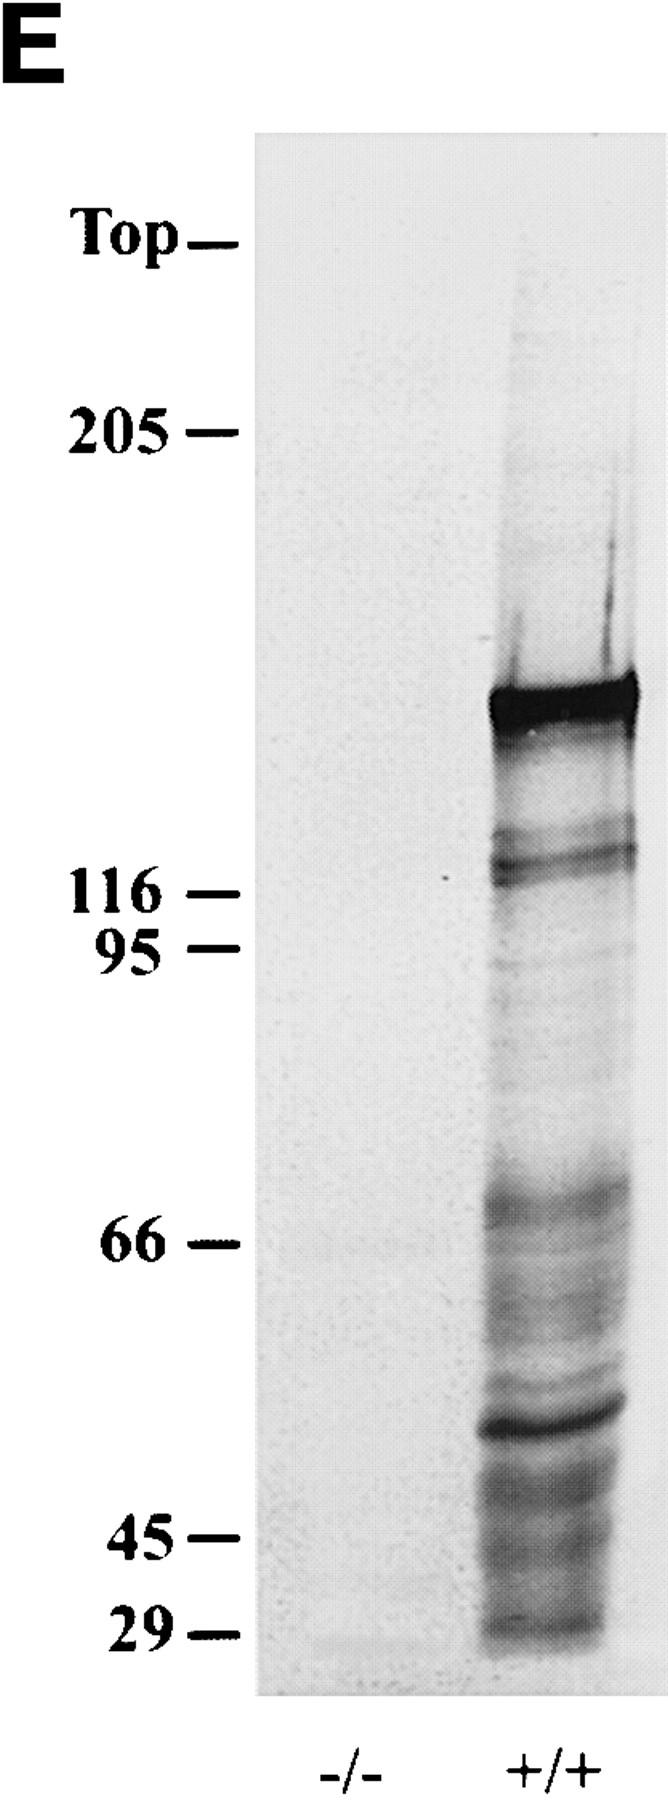
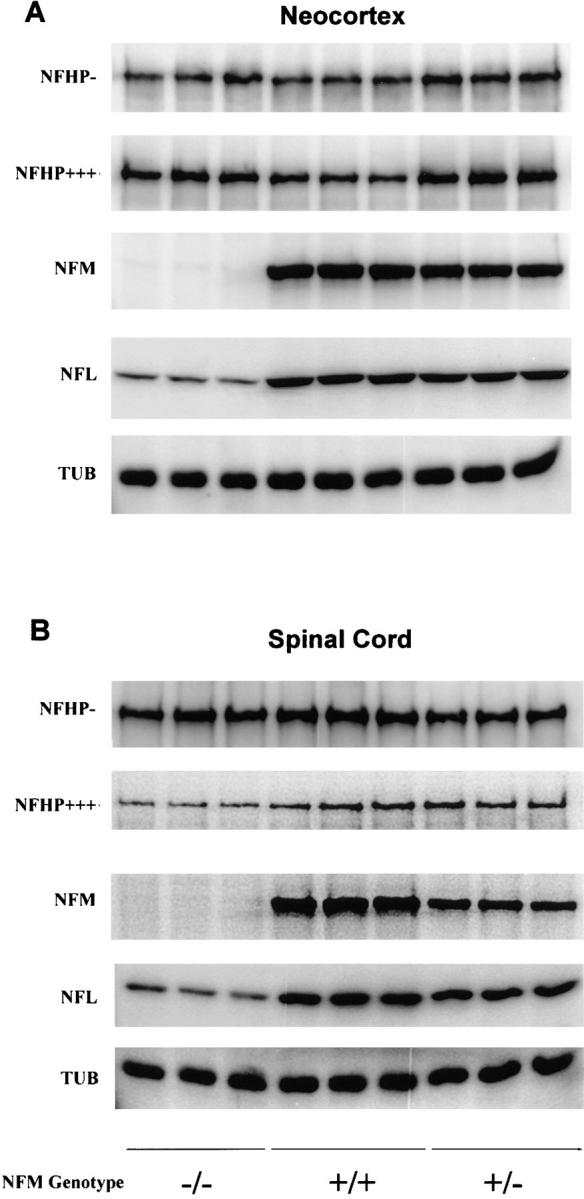
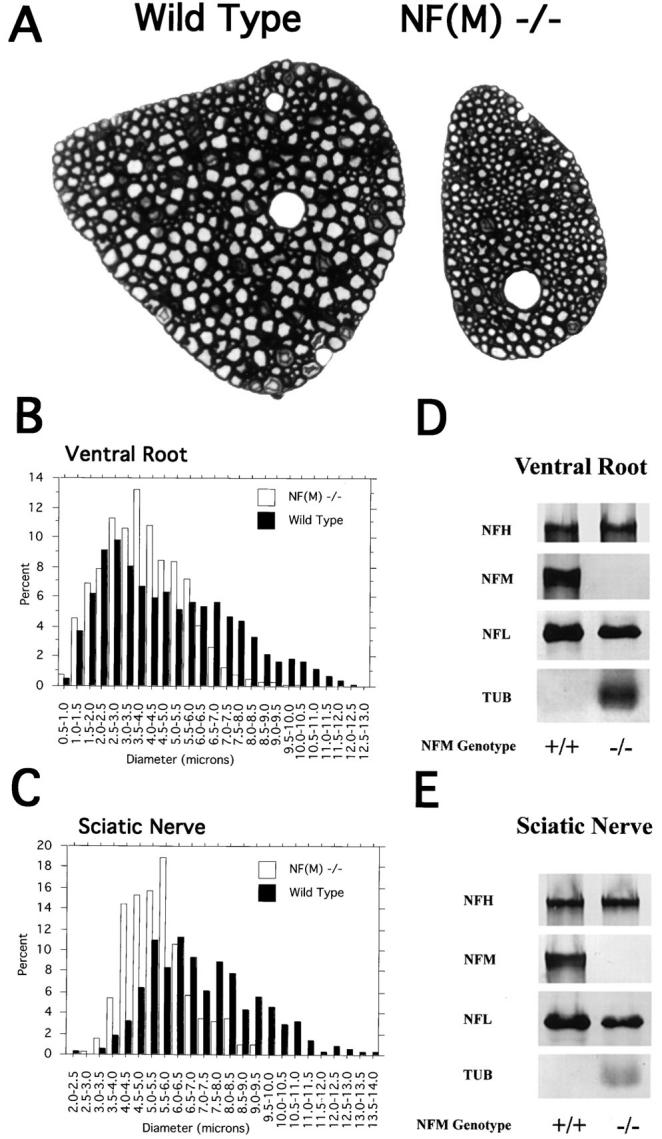
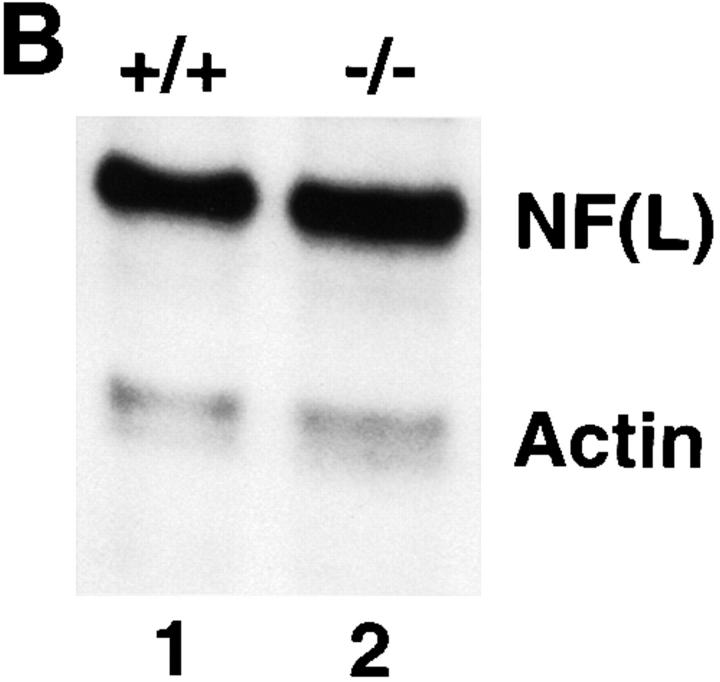
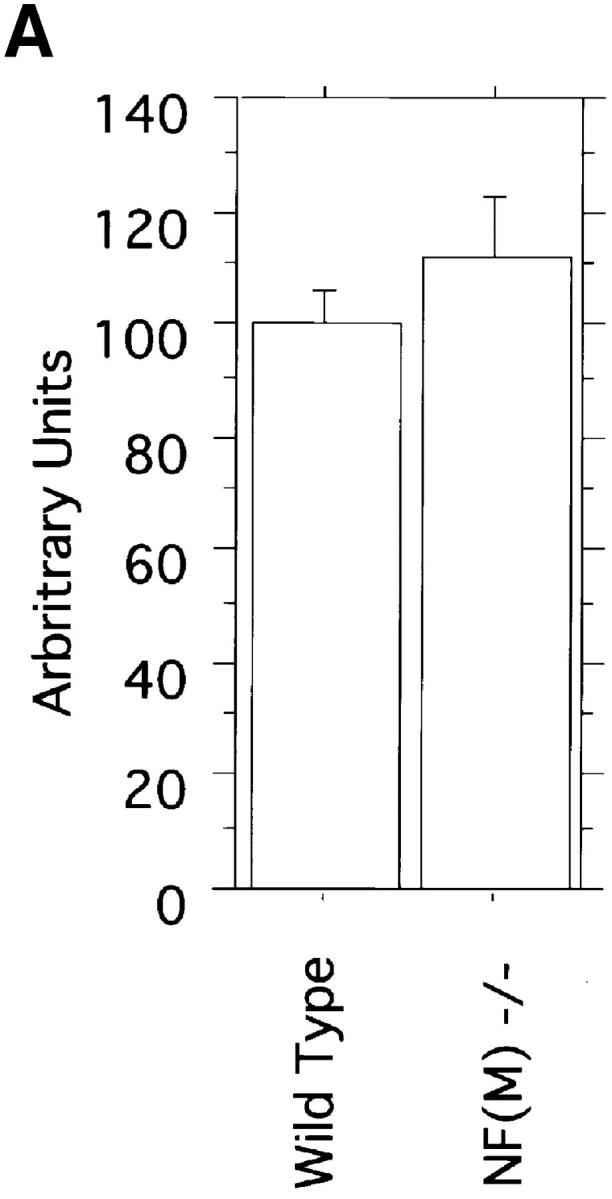
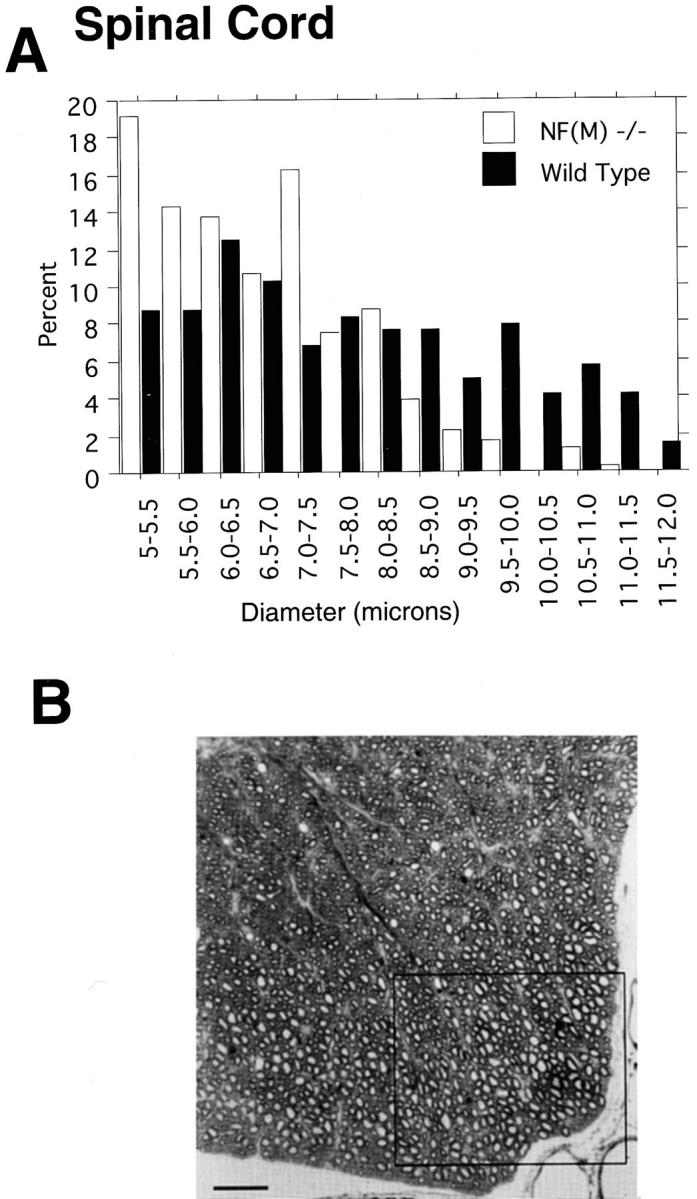
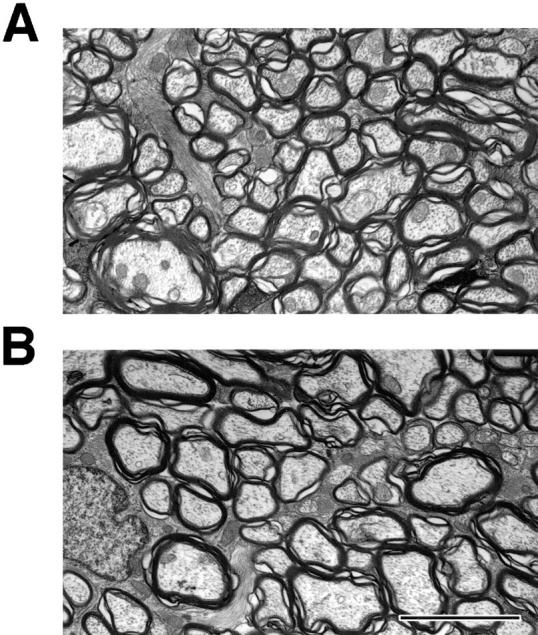
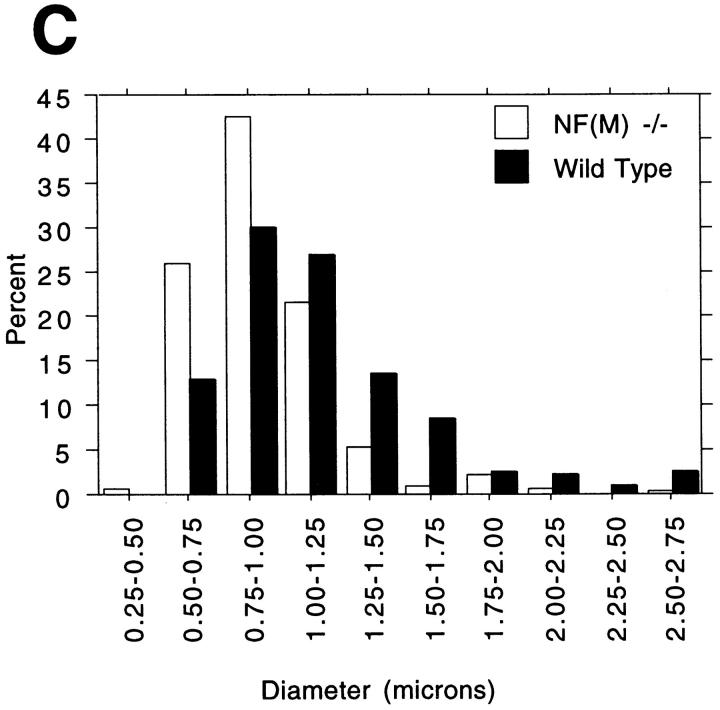
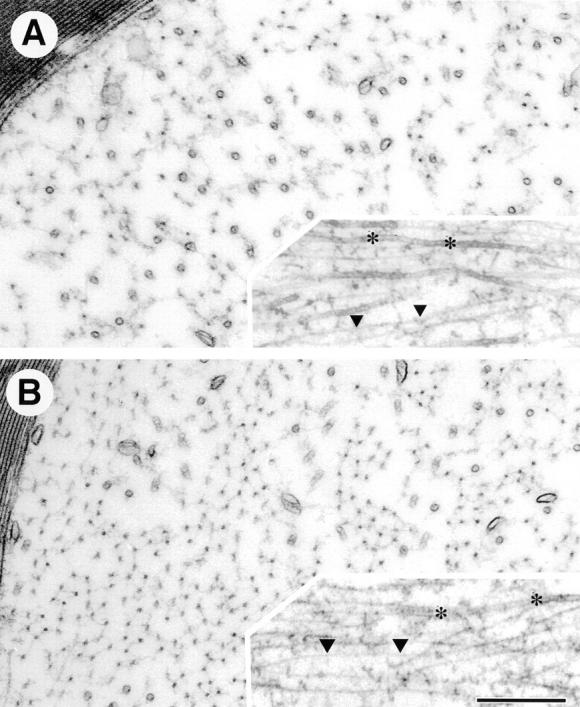
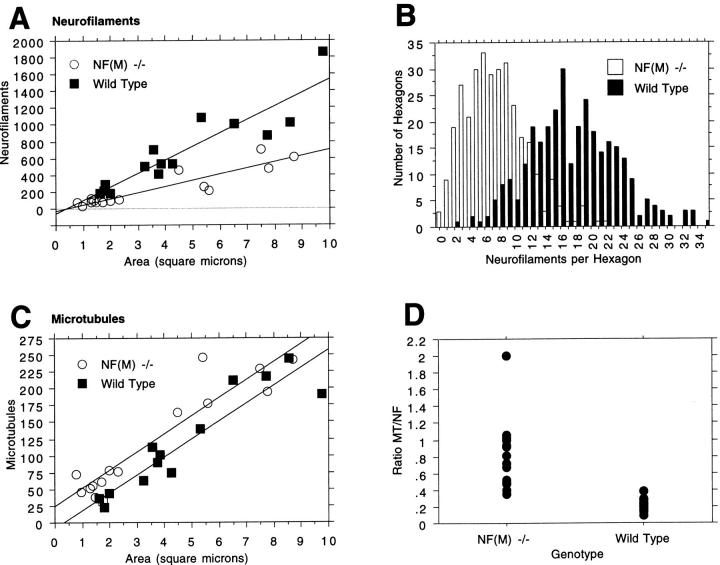
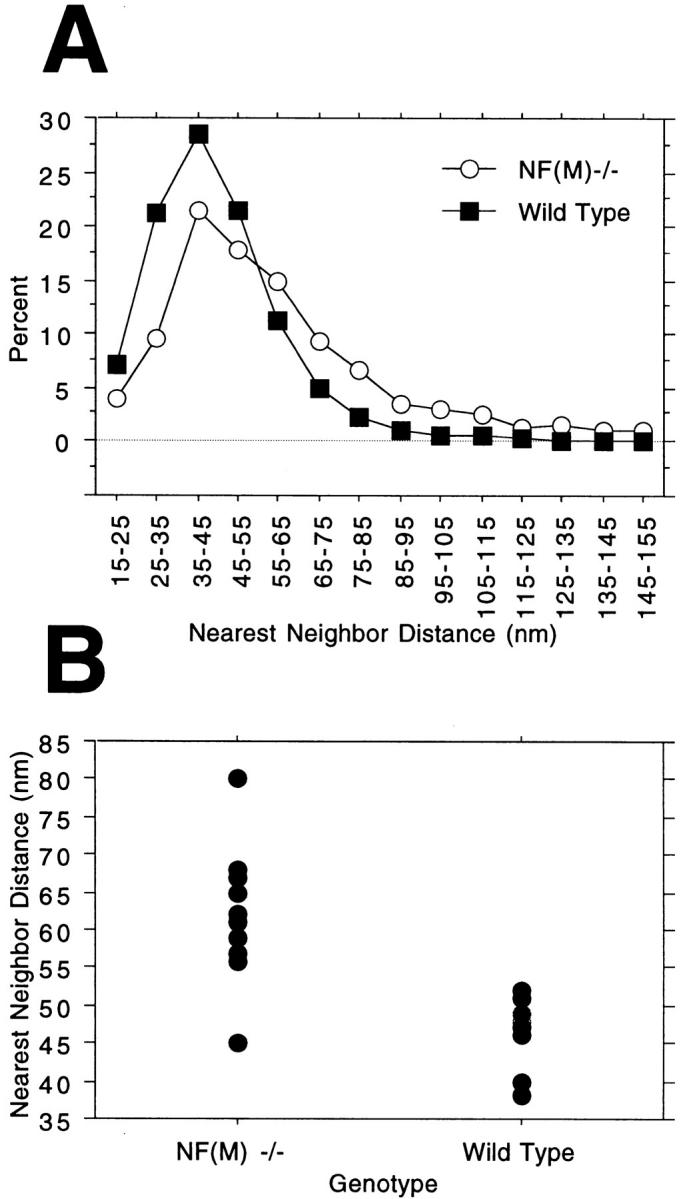
Neurofilaments (NFs) are prominent components of large myelinated axons and probably the most abundant of neuronal intermediate filament proteins. Here we show that mice with a null mutation in the mid-sized NF (NF-M) subunit have dramatically decreased levels of light NF (NF-L) and increased levels of heavy NF (NF-H). The calibers of both large and small diameter axons in the central and peripheral nervous systems are diminished. Axons of mutant animals contain fewer neurofilaments and increased numbers of microtubules. Yet the mice lack any overt behavioral phenotype or gross structural defects in the nervous system. These studies suggest that the NF-M subunit is a major regulator of the level of NF-L and that its presence is required to achieve maximal axonal diameter in all size classes of myelinated axons.


Figures

Figure 1
Figure 1
Targeted disruption of the mouse NF-M gene. (A) Targeting strategy for disruption of the mouse NF-M gene. The structure of the endogenous mouse NF-M is shown in the top line. Exons are indicated by open boxes. A targeting vector designed to use positive and negative selection (23) is shown in the center line. A PGK/Neo resistance gene was cloned in an anti-sense orientation and replaces an ∼800-bp SacI–EcoRI fragment that includes the last 93 bp of exon 1 and most of intron 1. It contains 2 kb of 5′ and 1.5 kb of 3′ homologous sequence and was linearized with HindIII. A map of the targeted recombinant gene is shown in the bottom line of the panel. The overall targeting frequency was ∼1 in 150 clones. (B) Southern blot of DNA from mice with disrupted NF-M alleles. A Southern blot of tail DNA from offspring of a heterozygous/heterozygous mating is shown. Blotting was performed with the downstream HindIII probe indicated in A. Successful targeting converts a wild-type (WT) 7.2-kb BamHI fragment to a 5.5-kb mutant (M) band. Examples of wild-type (+/+), heterozygous (+/−), and null mutant animals (−/−) are indicated. In subsequent crosses mutant and wild-type NF-M alleles were also identified by PCR using primers (indicated by arrows in A) P1 (5′ ATCCAGGCGTCGCACATCACGGTA 3′) and P2 (5′ CTGCCGTTCCAGGGACTCCTTAGT 3′) derived from the wild-type NF-M gene and P3 (5′ GTTCTAAGTACTGTGGTTTCC 3′) derived from the PGK 3′ nontranslated region. (C and D) RNA analysis of mutant animals. In C an RNase protection assay was performed with 25,000 CPM of an exon 3 murine NF-M probe (3′ to the neomycin resistance gene) and 5,000 CPM of a GAPDH probe. Protected fragments were separated as double-stranded RNA on a 6% native polyacrylamide gel. Positions of the 240-bp GAPDH and 129-bp NF-M protected fragments are indicated. Lanes were hybridized with 10 μg of tRNA (lane 1) or with 10 μg of total brain RNA from an unrelated wild-type mouse (lane 2), a homozygous mutant (−/−, lane 3), and heterozygous (+/−, lane 4) or wild-type (+/+, lane 5) littermates. In D an RNase protection assay was performed with 25,000 CPM of an exon 1 murine NF-M probe (5′ to the neomycin resistance gene) and 25,000 CPM of a murine β-actin probe. Positions of the 65-bp actin and 150-bp NF-M protected fragments are indicated. Lanes were hybridized with 10 μg of tRNA (lane 1) or with 10 μg of total brain RNA from a homozygous mutant (−/−, lane 2) or wild-type (+/+, lane 3) animal. (E) No detection of NF-M protein in NF-M null mice. Western blotting was performed with a polyclonal rabbit antiserum (NFM-N) raised against the head domain of NF-M (18). No full-length or truncated NF-M protein could be detected in the spinal cord of NF-M−/− mice. Lower molecular weight bands in the wild-type (+/+) lane likely reflect degradation products.
Figure 1
Figure 1
Targeted disruption of the mouse NF-M gene. (A) Targeting strategy for disruption of the mouse NF-M gene. The structure of the endogenous mouse NF-M is shown in the top line. Exons are indicated by open boxes. A targeting vector designed to use positive and negative selection (23) is shown in the center line. A PGK/Neo resistance gene was cloned in an anti-sense orientation and replaces an ∼800-bp SacI–EcoRI fragment that includes the last 93 bp of exon 1 and most of intron 1. It contains 2 kb of 5′ and 1.5 kb of 3′ homologous sequence and was linearized with HindIII. A map of the targeted recombinant gene is shown in the bottom line of the panel. The overall targeting frequency was ∼1 in 150 clones. (B) Southern blot of DNA from mice with disrupted NF-M alleles. A Southern blot of tail DNA from offspring of a heterozygous/heterozygous mating is shown. Blotting was performed with the downstream HindIII probe indicated in A. Successful targeting converts a wild-type (WT) 7.2-kb BamHI fragment to a 5.5-kb mutant (M) band. Examples of wild-type (+/+), heterozygous (+/−), and null mutant animals (−/−) are indicated. In subsequent crosses mutant and wild-type NF-M alleles were also identified by PCR using primers (indicated by arrows in A) P1 (5′ ATCCAGGCGTCGCACATCACGGTA 3′) and P2 (5′ CTGCCGTTCCAGGGACTCCTTAGT 3′) derived from the wild-type NF-M gene and P3 (5′ GTTCTAAGTACTGTGGTTTCC 3′) derived from the PGK 3′ nontranslated region. (C and D) RNA analysis of mutant animals. In C an RNase protection assay was performed with 25,000 CPM of an exon 3 murine NF-M probe (3′ to the neomycin resistance gene) and 5,000 CPM of a GAPDH probe. Protected fragments were separated as double-stranded RNA on a 6% native polyacrylamide gel. Positions of the 240-bp GAPDH and 129-bp NF-M protected fragments are indicated. Lanes were hybridized with 10 μg of tRNA (lane 1) or with 10 μg of total brain RNA from an unrelated wild-type mouse (lane 2), a homozygous mutant (−/−, lane 3), and heterozygous (+/−, lane 4) or wild-type (+/+, lane 5) littermates. In D an RNase protection assay was performed with 25,000 CPM of an exon 1 murine NF-M probe (5′ to the neomycin resistance gene) and 25,000 CPM of a murine β-actin probe. Positions of the 65-bp actin and 150-bp NF-M protected fragments are indicated. Lanes were hybridized with 10 μg of tRNA (lane 1) or with 10 μg of total brain RNA from a homozygous mutant (−/−, lane 2) or wild-type (+/+, lane 3) animal. (E) No detection of NF-M protein in NF-M null mice. Western blotting was performed with a polyclonal rabbit antiserum (NFM-N) raised against the head domain of NF-M (18). No full-length or truncated NF-M protein could be detected in the spinal cord of NF-M−/− mice. Lower molecular weight bands in the wild-type (+/+) lane likely reflect degradation products.
Figure 2
Figure 2
Quantitative Western blots of neocortex and spinal cord of NF-M heterozygous (+/−), NF-M null (−/−), and wild-type mice (+/+). Each sample was loaded in triplicate. The NF-M immunoreactivities are decreased in both neocortex and spinal cord of the heterozygous mice and are undetectable in the null mice. A concomitant decrease in NF-L is also observed in both neocortex and spinal cord of the heterozygous and null mice. The NF-H signals increase in the neocortex of both heterozygous and null mice but not in the spinal cord. NFHP− is measured with RMdO9, a mAb against poorly or nonphosphorylated NF-H epitopes; NFHP+++, with RM024 a mAb specific for highly phosphorylated epitopes; NF-M, with RM0189, a mAb against the rod domain of NF-M; NF-L, with a polyclonal rabbit anti-NFL antiserum; TUB, with a mAb specific for β-tubulin. All animals were 3 mo old.
Figure 4
Figure 4
Axon calibers in L5 ventral roots from wild-type and NF-M null mutant animals. (A) Light microscopy of toluidine blue–stained L5 ventral roots from a 4-mo-old wild-type and NF-M null mutant mouse. Note the reduced size of the NF-M mutant (−/−) root as well as the absence in the mutant of axons with calibers comparable to the largest present in the control. (B) Diameters of all myelinated axons were measured in L5 roots (n = 4 wild type, n = 3 mutant). Note the marked reduction of axons >8 μm in diameter in the mutant accompanied by an increase in smaller diameter fibers. (C) Axon diameters were measured in the sciatic nerve of a 4-mo-old wild-type and mutant animal. Quantitation was performed by sampling every fifth myelinated axon in the largest trunk of a proximal portion of the nerve. Data is presented for all axons >2 μm in diameter (n = 374, wild type, 313 NF-M−/−). Note the absence of any axons >9.0 μm in diameter in the null mutant accompanied by a shift towards smaller diameter fibers. (D and E) Western blots of neurofilament content in the ventral roots (D) and sciatic nerves (E) of 4-mo-old wild-type and NF-M null mice. In D the total protein recovered from one L5 ventral root was loaded per lane. For sciatic nerve (E) 10 μg of total protein per lane was loaded for neurofilament studies and 50 μg of total protein per lane was used for β-tubulin immunoreactivity. NF-M was not detected in the null mouse. The level of NF-L protein decreased by ∼50% in both the ventral roots and sciatic nerve in the null mutant animal. An increase in the level of β-tubulin immunoreactivity was observed in both nerves in the NF-M null mouse.
Figure 3
Figure 3
NF-L mRNA levels in NF-M null mutant animals. (A) Quantitative RNase protection assays were performed on total brain RNA from two wild-type and two NF-M−/− animals each 2 mo old. NF-L levels were normalized to the expression of β-actin. Data from three independent determinations for each sample is shown. Results are presented as arbitrary units with wild-type NF-L levels set as 100. NF-L levels in wild type were 100 ± 6 (SEM) and in NF-M−/− animals 111 ± 11 (P = 0.35, unpaired t test). (B) A sample RNase protection assay is shown. 5 μg of total brain RNA from a wild-type (lane 1) or NF-M null mutant (lane 2) were hybridized with 20,000 cpm of a mouse NF-L probe and 10,000 cpm of a murine β-actin probe. Protected fragments were separated as double stranded RNA on a 6% native polyacrylamide gel. Positions of the NF-L and actin bands are indicated.
Figure 3
Figure 3
NF-L mRNA levels in NF-M null mutant animals. (A) Quantitative RNase protection assays were performed on total brain RNA from two wild-type and two NF-M−/− animals each 2 mo old. NF-L levels were normalized to the expression of β-actin. Data from three independent determinations for each sample is shown. Results are presented as arbitrary units with wild-type NF-L levels set as 100. NF-L levels in wild type were 100 ± 6 (SEM) and in NF-M−/− animals 111 ± 11 (P = 0.35, unpaired t test). (B) A sample RNase protection assay is shown. 5 μg of total brain RNA from a wild-type (lane 1) or NF-M null mutant (lane 2) were hybridized with 20,000 cpm of a mouse NF-L probe and 10,000 cpm of a murine β-actin probe. Protected fragments were separated as double stranded RNA on a 6% native polyacrylamide gel. Positions of the NF-L and actin bands are indicated.
Figure 5
Figure 5
Axonal calibers in ventral spinal cord of wild-type and NF-M mutant mice. (A) Axon sizes were measured in a 1.9 × 105 μm2 area of the ventral medial portion of C3 (boxed area shown in B). Data is presented for all axons >5 μm in diameter (n = 263 for wild type and 307 for NF-M−/−) from a 5-mo-old wild-type and mutant NF-M animal. Note the dramatic reduction in large diameter fibers accompanied by a shift to smaller diameter fibers in the null mutant. (B) Light microscopy of a toluidine blue– stained section of ventral cervical cord (C3) from a wild-type animal. Box indicates the region used to generate the frequency distributions shown in A. Bar, 50 μm.
Figure 6
Figure 6
Axon calibers in optic nerves. (A and B) Electron micrographs from optic nerves of 5-mo-old NF-M null mutant (A) and wild-type (B) mice. Note the generally reduced size of myelinated axons in the NF-M animal. (C) Axon sizes were determined in the optic nerves of a 5-mo-old wild type and NF-M null mutant. Quantitation was performed by sampling every third myelinated axon in five randomly selected fields (n = 193 wild type, 322 NF-M−/−). Note the shift towards smaller diameter fibers in the mutant. Bar, 3 μm.
Figure 6
Figure 6
Axon calibers in optic nerves. (A and B) Electron micrographs from optic nerves of 5-mo-old NF-M null mutant (A) and wild-type (B) mice. Note the generally reduced size of myelinated axons in the NF-M animal. (C) Axon sizes were determined in the optic nerves of a 5-mo-old wild type and NF-M null mutant. Quantitation was performed by sampling every third myelinated axon in five randomly selected fields (n = 193 wild type, 322 NF-M−/−). Note the shift towards smaller diameter fibers in the mutant. Bar, 3 μm.
Figure 7
Figure 7
Appearance of neurofilaments in mice with an NF-M null mutation. (A and B) NFs in axons of L5 ventral root are viewed in cross section and longitudinally (insets) from 4-mo-old NF-M null mutant (A) or wild-type mice (B). NFs (triangles) are reduced in the NF-M null mutant (A) as compared with control (B), while microtubules (asterisks) are increased. Bar, 300 nm.
Figure 8
Figure 8
Neurofilament and microtubule content in NF-M–deficient animals. (A) NFs were counted in the internodal regions of L5 ventral root axons of 4-mo-old mutant and control animals. The number of NFs in each axon was plotted against axonal size (area in μm2). Note that in axons of similar size, the wild type has more NFs than the NF-M null mutant. (B) NF densities were determined using methods similar to those described by Price et al. (35). A template of hexagons was applied over each electron micrograph and the number of NFs per hexagon counted. At least 300 hexagons (n = 314 wild type, 322 NF-M mutant) each equivalent to an area of 0.10 μm2 were counted and a frequency distribution plot was generated showing the number of NFs per hexagon. Note the dramatically reduced density of NFs in the NF-M mutant. (C) Microtubules were counted in the same axons as in A. In contrast to NFs, axons in NF-M mutant animals have more microtubules than axons of comparable size in wild type. (D) The ratio of microtubules (MT) to NFs is shown for the axons in A and C.
Figure 9
Figure 9
Nearest neighbor analysis of neurofilament spacing in NF-M–deficient animals. (A) Interfilament spacing was analyzed in 10 mutant (range 0.78–8.72 μm2, average 3.91 ± 3.10 SD) and 10 wild-type (range 1.63–8.58, average 3.99 ± 2.50) axons from the L5 ventral roots of 4-mo-old animals. The positions of all NFs in each axon (n = 1,683 mutant and 4,709 wild type) were determined and nearest neighbor distances computed. Note that although the decreased NF density in the mutant results in an increased average interfilament distance, the modal distance is similar in both mutant and control. (B) Values for the individual axons measured in A are shown.

References

    1. Berthold, C.-H. 1978. Morphology of normal peripheral axons. In Physiology and Pathobiology of Axons. S.G. Waxman, editor. Raven Press, New York. 3–63.
    1. Bradley, A. 1987. Production and analysis of chimaeric mice. In Teratocarcinomas and Embryonic Stem Cells: A Practical Approach. E.J. Robertson, editor. IRL Press, Washington, DC. 113–151.
    1. Burgoyne RD, Cambray-Deakin MA. The cellular neurobiology of neuronal development: the cerebellar granule cell. Brain Res Rev. 1988;13:77–101. - PubMed
    1. Carden MJ, Trojanowski JQ, Schleapfer WW, Lee VM-Y. Two-stage expression of neurofilament polypeptides during rat neurogenesis with early establishment of adult phosphorylation. J Neurosci. 1987;7:3489–3504. - PMC - PubMed
    1. Ching G, Liem R. Assembly of type IV neuronal intermediate filaments in nonneuronal cells in the absence of preexisting cytoplasmic intermediate filaments. J Cell Biol. 1993;122:1323–1335. - PMC - PubMed

Publication types