. 1998 May 15;18(10):3597-605.
doi: 10.1523/JNEUROSCI.18-10-03597.1998.

Region-specific and calcium-dependent increase in dialysate choline levels by NMDA

Affiliations

Region-specific and calcium-dependent increase in dialysate choline levels by NMDA

A Zapata et al. J Neurosci. .

Abstract

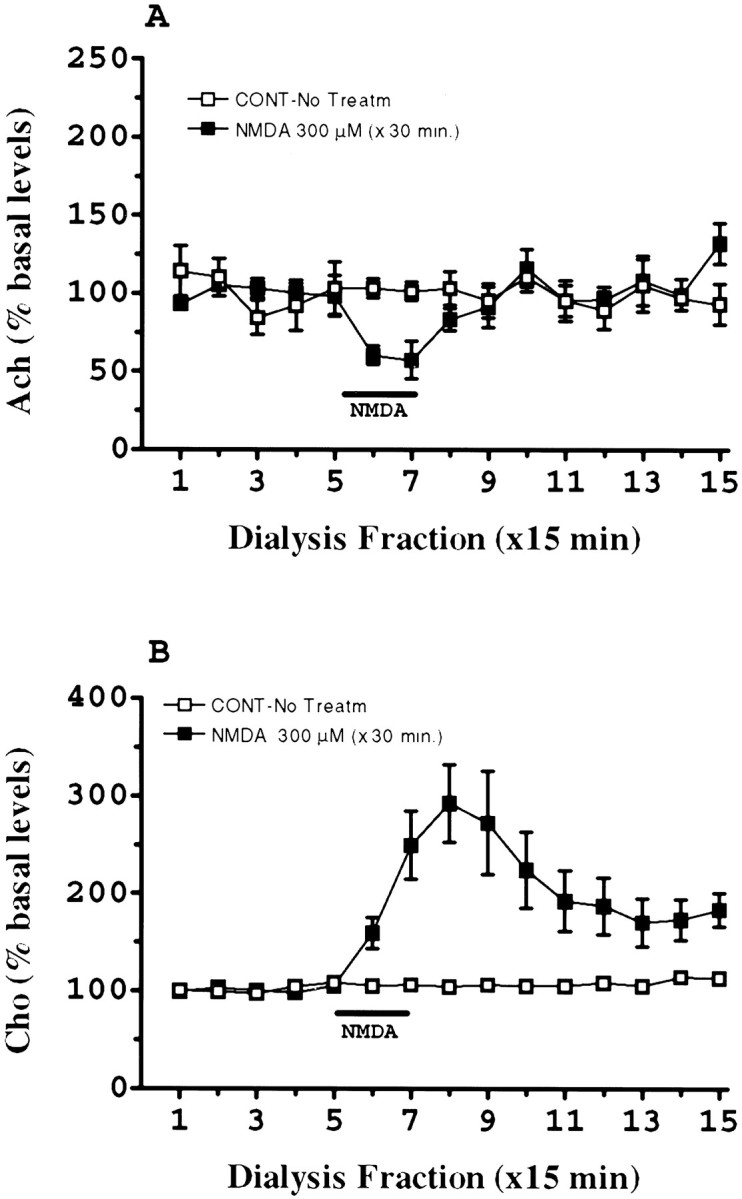
NMDA receptor-induced excitotoxicity has been hypothesized to mediate abnormal choline (Cho) metabolism that is involved in alterations in membrane permeability and cell death in certain neurodegenerative disorders. To determine whether NMDA receptor overactivation modulates choline metabolism in vivo, we investigated the effects of NMDA on interstitial choline concentrations using microdialysis. Perfusion of NMDA by retrodialysis increased dialysate choline (approximately 400%) and reduced dialysate acetylcholine (Ach) (approximately 40%). Choline levels remained increased for at least 2.5 hr, but acetylcholine returned to pretreatment values 75 min after NMDA perfusion. The NMDA-evoked increase in dialysate choline was calcium and concentration dependent and was prevented with 1 mM AP-5, a competitive NMDA antagonist, but was not altered by mepacrine, a phospholipase A2 inhibitor. NMDA increased extracellular choline levels four- to fivefold in prefrontal cortex and hippocampus, produced a slight increase in neostriatum, and did not modify dialysate choline in cerebellum. Perfusion with NMDA for 2 hr produced a delayed, but not acute, reduction in choline acetyltransferase activity in the area surrounding the dialysis probe. Consistent with a lack of acute cholinergic neurotoxicity evoked by this treatment, basal acetylcholine levels were unaltered by 2 hr of continuous NMDA perfusion. Prolonged NMDA perfusion produced a 34% decrease in phosphatidylcholine content in the lipid fraction of the tissue surrounding the dialysis probe. These results show that NMDA modulates choline metabolism, eliciting a receptor-mediated, calcium-dependent, and region-specific increase in extracellular choline from membrane phospholipids that is not mediated by phospholipase A2 and precedes delayed excitotoxic neuronal cell death.


Figures

Fig. 1.
Fig. 1.
Effects of 30 min perfusion with 300 μm NMDA through the microdialysis probe on extracellular Ach (A) and Cho (B) levels in prefrontal cortex. Symbols: □, control; ▪, NMDA. Basal levels (dialysate picomoles per microliter) and number of animals per group (mean ± SEM) were as follows: Ach, □, 0.0354 ± 0.0046 (n = 5); ▪, 0.0349 ± 0.0037 (n = 6); Cho, □, 1.6503 ± 0.2497 (n = 5); ▪, 2.1078 ± 0.4149 (n = 6). The horizontal barrepresents the period of NMDA perfusion.
Fig. 2.
Fig. 2.
Effects of continuous perfusion with 300 μm NMDA through the microdialysis probe on extracellular Ach (A) and Cho (B) levels in prefrontal cortex: prevention by AP-5. Symbols: ▪, NMDA; ▾, AP-5; ▴, AP-5 + NMDA. Basal levels (dialysate picomoles per microliter) and number of animals per group (mean ± SEM) were as follows: Ach, ▪, 0.0376 ± 0.0039 (n = 6); ▾, 0.0341 ± 0.0059 (n = 4); ▴, 0.0275 ± 0.0025 (n = 4). Cho, ▪, 1.8928 ± 0.2959 (n = 6); ▾, 0.7028 ± 0.1246 (n = 4); ▴, 1.4444 ± 0.4496 (n = 4). Horizontal bars represent the period of continuous perfusion with NMDA or AP-5.
Fig. 3.
Fig. 3.
Influence of the omission of Mg2+ in the perfusion fluid on the effects of continuous perfusion with 300 μm NMDA on dialysate Ach (A) and Cho (B) levels in prefrontal cortex. Symbols: ▪, Mg2+; □, no Mg2+. Basal levels (dialysate picomoles per microliter) and number of animals per group (mean ± SEM) were as follows: Cho, ▪, 1.67 ± 0.12 (n = 5); □, 1.50 ± 0.10 (n = 5); ACh, ▪, 0.0389 ± 0.005 (n = 5); □, 0.0500 ± 0.008 (n = 5). The horizontal barrepresents the period of NMDA perfusion.
Fig. 4.
Fig. 4.
Effects of continuous perfusion with 300 μm NMDA through the microdialysis probe on extracellular Cho levels in prefrontal cortex: calcium dependence. Symbols: ▪, NMDA; ▴, no Ca2+ + NMDA; ▾, no Ca2+ + EGTA 5 mm + NMDA. Basal levels (dialysate picomoles per microliter) and number of animals per group (mean ± SEM were as follows: Cho, ▪, 1.5505 ± 0.1038 (n = 6); ▴, 1.8098 ± 0.3171 (n = 4); ▾, 3.3017 ± 0.3750 (n = 4). The horizontal barrepresents the period of NMDA perfusion.
Fig. 5.
Fig. 5.
Effects of continuous perfusion with NMDA through the microdialysis probe on extracellular Ach (A) and Cho (B) levels in prefrontal cortex: dose–response. Symbols: ▪, control; ▵, NMDA 50 μm; ▿, NMDA 100 μm; ⋄, NMDA 300 μm; ○, NMDA 600 μm. Basal levels (dialysate picomoles per microliter) and number of animals per group (mean ± SEM) were as follows: Ach, ▪, 0.0354 ± 0.0046 (n = 5); ▵, 0.0416 ± 0.0186 (n = 3); ▿, 0.0410 ± 0.0054 (n = 5); ⋄, 0.0509 ± 0.0078 (n = 5); ○, 0.0420 ± 0.0052 (n = 3); Cho, ▪, 1.6503 ± 0.2497 (n = 5); ▵, 2.0743 ± 0.8061 (n = 3); ▿, 1.9570 ± 0.4533 (n = 5); ⋄, 1.4892 ± 0.1027 (n = 5); ○, 0.8294 ± 0.1501 (n = 3). The horizontal barrepresents the period of NMDA perfusion.
Fig. 6.
Fig. 6.
Effects of continuous perfusion with 300 μm NMDA through the microdialysis probe on extracellular Ach (A) and Cho (B) levels in different brain areas. Symbols: ▪, prefrontal cortex; ▵, neostriatum; ▿, ventral hippocampus; ⋄, cerebellum. Basal levels (dialysate picomoles per microliter) and number of animals per group (mean ± SEM) were as follows: Ach, ▪, 0.0509 ± 0.0078 (n = 5); ▵, 0.0766 ± 0.0196 (n = 4); ▿, 0.0257 ± 0.0030 (n = 4); ⋄, below detectable range; Cho, ▪, 1.4892 ± 0.1027 (n = 5); ⋄, 1.0367 ± 0.1301 (n = 4); ▿, 0.7708 ± 0.0675 (n = 4); ⋄, 3.2175 ± 0.6227 (n = 5). The horizontal barrepresents the period of NMDA perfusion.
Fig. 7.
Fig. 7.
Effects of continuous perfusion with 100 mm KCl through the microdialysis probe on extracellular Ach and Cho levels in prefrontal cortex. Symbols: ▪, Ach; ▴, Cho. Basal levels (dialysate picomoles per microliter) and number of animals per group (mean ± SEM) were as follows: Ach, 0.0479 ± 0.0054 (n = 6); Cho, 2.5981 ± 0.2860 (n = 6). The horizontal barrepresents the period of KCl perfusion.
Fig. 8.
Fig. 8.
Effects of continuous perfusion with 300 μm NMDA for 2.5 hr on ChAT activity measured in a micropunch tissue sample taken around the microdialysis probe location in the prefrontal cortex. Tissue was dissected immediately after dialysis (0 d) or 7 d after. Data were expressed as percentage activity relative to the contralateral prefrontal cortex for each animal. No significant differences were found in both control (KRB-perfused) groups, and they were pooled for analysis. Number of animals: KRB (8), NMDA 0 d (4), NMDA 7 d (4). *, significantly different from the other two groups;p < 0.05, Student–Newman–Keuls.
Fig. 9.
Fig. 9.
Effects of a prolonged perfusion with 600 μm NMDA for 12 hr on dialysate Cho levels. Symbols: □, control perfusion with KRB (n = 6); ▪, NMDA (600 μm) perfusion (n = 10).Inset: Content of Cho in the lipid fraction of a micropunch tissue sample taken around the microdialysis probe location in the prefrontal cortex after perfusion with NMDA (600 μm) for 12 hr. Tissue was dissected immediately after dialysis. Data were expressed as percentage relative to the contralateral prefrontal cortex for each animal. Cho content in the lipid fraction expressed in nanomoles per milligram of wet weight was as follows: controls (n = 6), contralateral side = 14 ± 1, probe side 13 ± 1; NMDA treatment (n = 10), contralateral side = 16 ± 1, probe side 10 ± 0.5. *, significantly different from control group; p < 0.05, Student–Newman–Keuls.
Fig. 10.
Fig. 10.
Effect of mepacrine on NMDA-induced dialysate Ach (A) and Cho (B). Mepacrine was perfused for 30 min before NMDA. Pilot experiments showed that mepacrine passed through the dialysis membrane. NMDA (300 μm) and mepacrine (300 μm) were co-perfused in prefrontal cortex for 1.25 hr. Symbols: ▪, perfusion with NMDA (300 μm); ▵, perfusion with mepacrine (300 μm); ○, perfusion with NMDA (300 μm) + mepacrine (300 μm). Basal levels of Ach (dialysate picomoles per microliter) and number of animals per group (mean ± SEM) were as follows: ▪, 0.0558 ± 0.0069 (n= 4); ▵, 0.0455 ± 0.0083 (n = 3); ○, 0.0578 ± 0.0087 (n = 4). Basal levels of Cho (dialysate picomoles per microliter) and number of animals per group (mean ± SEM) were as follows: ▪, 0.9593 ± 0.1478 (n = 4); ▵, 1.3475 ± 0.0904 (n = 3); ○, 1.3200 ± 0.2788 (n = 4). Horizontal bars represent period of drug perfusion.

Similar articles

Cited by

References

    1. Bazan NG, Rodriguez de Turco EB, Allan G. Mediators of injury in neurotrauma: intracellular signal transduction and gene expression. J Neurotrauma. 1995;12:791–814. - PubMed
    1. Benveniste H, Hansen AJ, Ottosen NS. Determination of brain interstitial concentrations by microdialysis. J Neurochem. 1989;52:1741–1750. - PubMed
    1. Bierer LM, Haroutunian V, Gabriel S, Knott PJ, Carlin LS, Purohit DP, Perl DP, Schmeidler J, Kanof P, Davis KL. Neurochemical correlates of dementia severity in Alzheimer’s disease: relative importance of the cholinergic deficits. J Neurochem. 1995;64:749–760. - PubMed
    1. Bogdanov MB, Wurtman RJ. Possible involvement of nitric oxide in NMDA-induced glutamate release in the rat striatum: an in vivo microdialysis study. Neurosci Lett. 1997;221:197–201. - PubMed
    1. Choi DW. Glutamate receptors and the induction of excitotoxic neuronal death. In: Bloom F, editor. Neuroscience: from the molecular to the cognitive. Elsevier; Amsterdam: 1994. pp. 47–51. - PubMed

Publication types

MeSH terms

LinkOut - more resources