

The processing of first- and second-order motion in human visual cortex assessed by functional magnetic resonance imaging (fMRI)
- PMID: 9570811
- PMCID: PMC6793149
- DOI: 10.1523/JNEUROSCI.18-10-03816.1998
The processing of first- and second-order motion in human visual cortex assessed by functional magnetic resonance imaging (fMRI)
Abstract
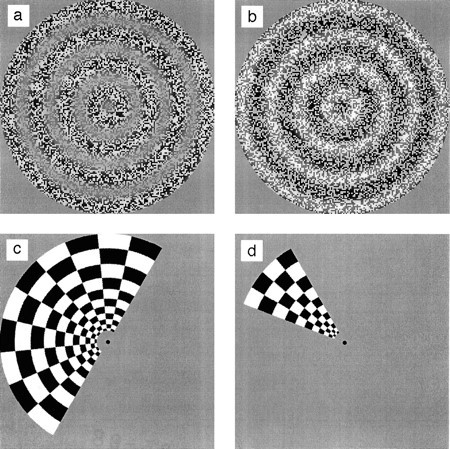
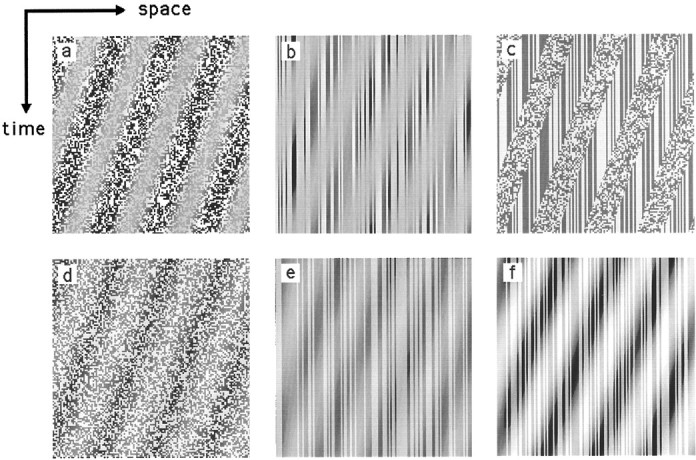
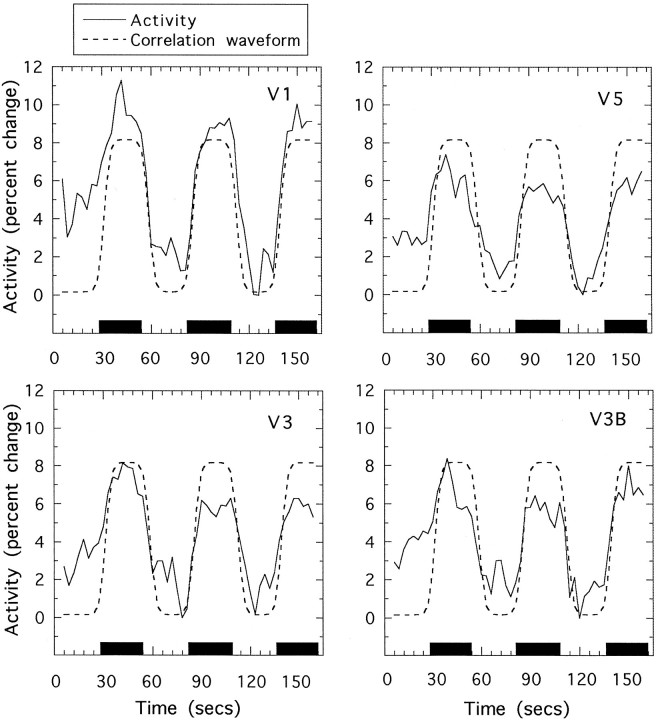
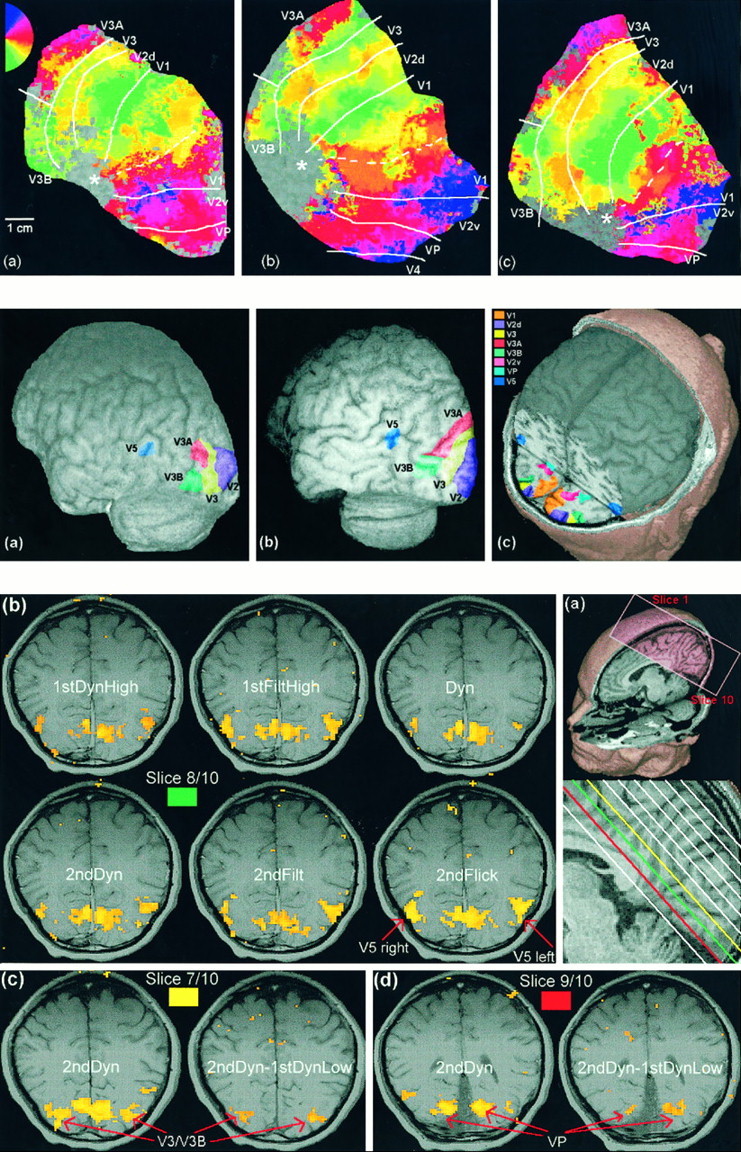
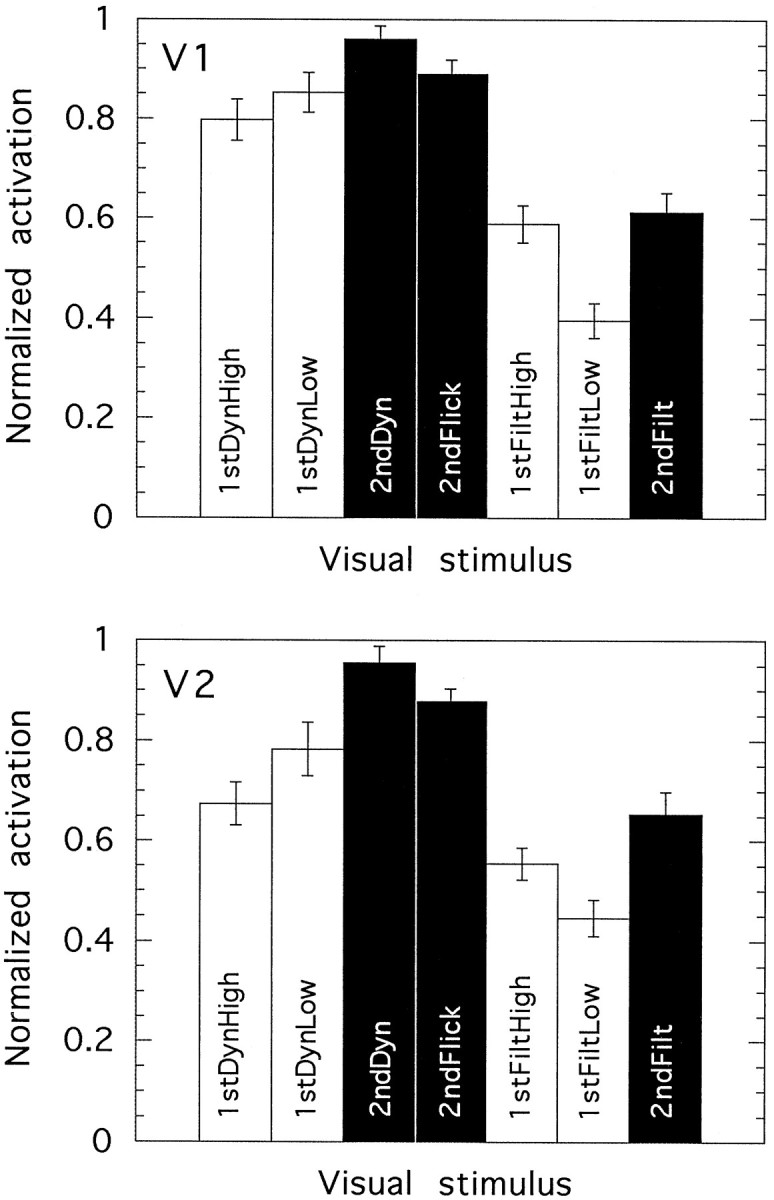
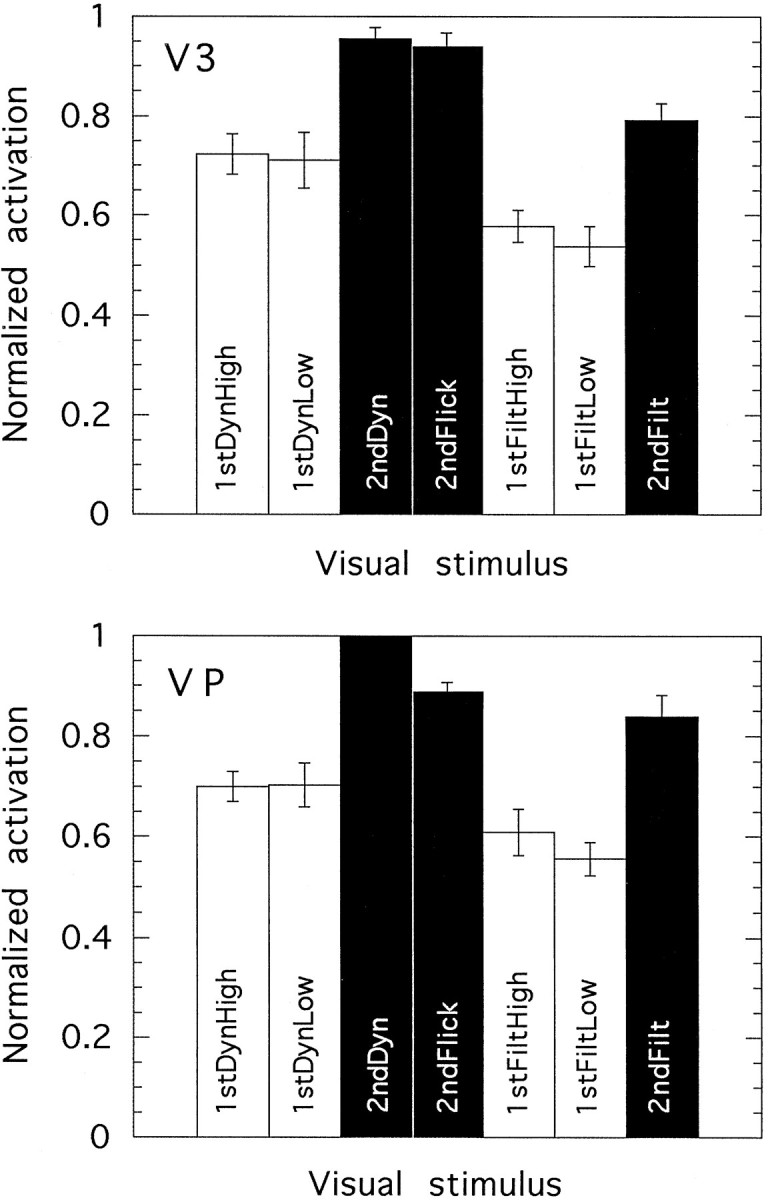
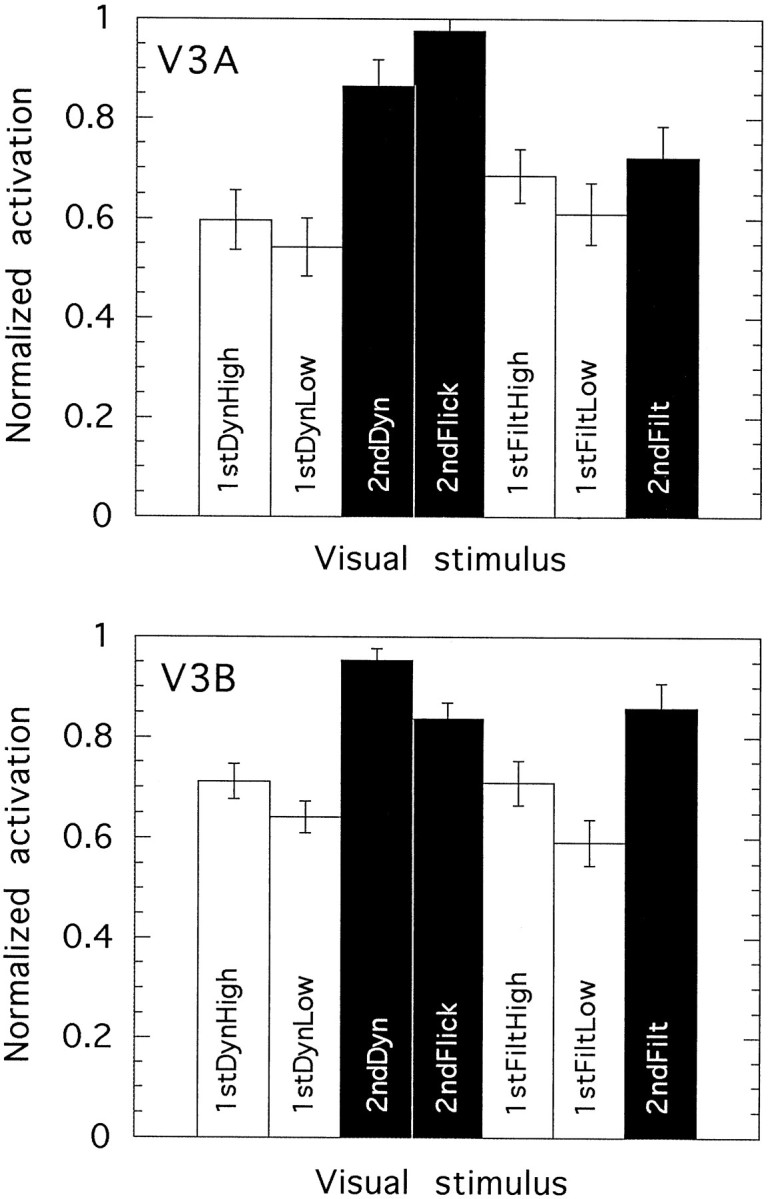
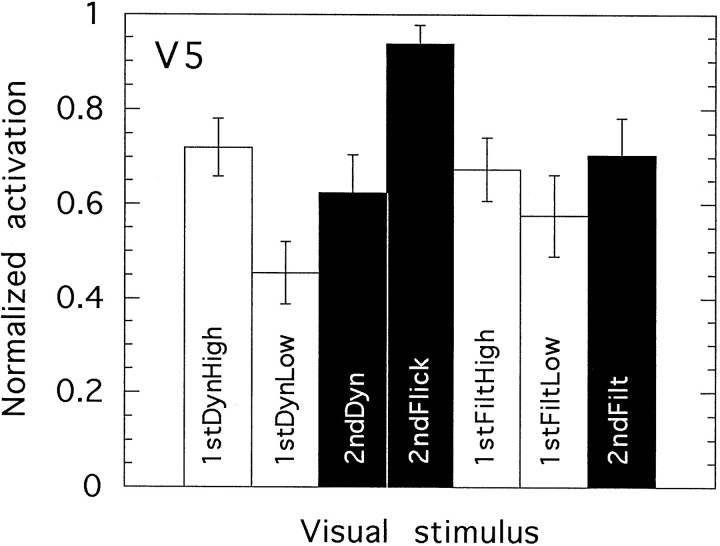
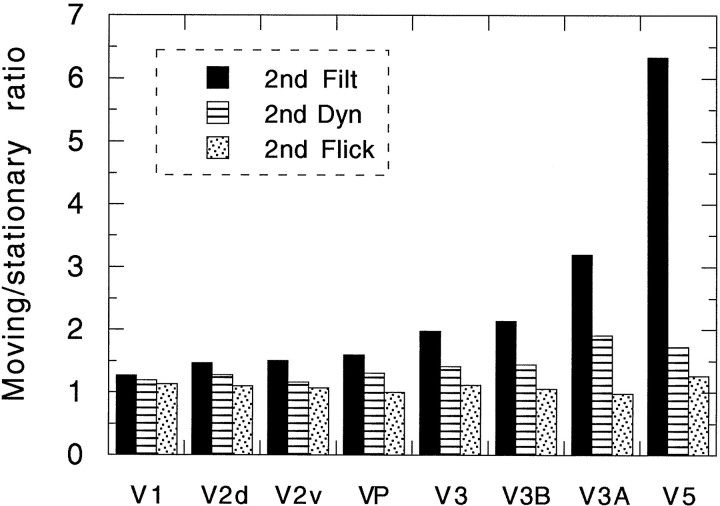
We have examined the activity levels produced in various areas of the human occipital cortex in response to various motion stimuli using functional magnetic resonance imaging (fMRI) methods. In addition to standard luminance-defined (first-order) motion, three types of second-order motion were used. The areas examined were the motion area V5 (MT) and the following areas that were delineated using retinotopic mapping procedures: V1, V2, V3, VP, V3A, and a new area that we refer to as V3B. Area V5 is strongly activated by second-order as well as by first-order motion. This activation is highly motion-specific. Areas V1 and V2 give good responses to all motion stimuli, but the activity seems to be related primarily to the local spatial and temporal structure in the image rather than to motion processing. Area V3 and its ventral counterpart VP also respond well to all our stimuli and show a slightly greater degree of motion specificity than do V1 and V2. Unlike V1 and V2, the response in V3 and VP is significantly greater for second-order motion than for first-order motion. This trend is evident, but less marked, in V3A and V3B and absent in V5. The results are consistent with the hypothesis that first-order motion sensitivity arises in V1, that second-order motion is first represented explicitly in V3 and VP, and that V5 (and perhaps also V3A and V3B) is involved in further processing of motion information, including the integration of motion signals of the two types.
Figures
Similar articles
-
Functional analysis of V3A and related areas in human visual cortex.J Neurosci. 1997 Sep 15;17(18):7060-78. doi: 10.1523/JNEUROSCI.17-18-07060.1997. J Neurosci. 1997. PMID: 9278542 Free PMC article.
-
Global Motion Processing in Human Visual Cortical Areas V2 and V3.J Neurosci. 2016 Jul 6;36(27):7314-24. doi: 10.1523/JNEUROSCI.0025-16.2016. J Neurosci. 2016. PMID: 27383603 Free PMC article.
-
Spatial frequency tuning in human retinotopic visual areas.J Vis. 2008 Aug 1;8(10):5.1-13. doi: 10.1167/8.10.5. J Vis. 2008. PMID: 19146347
-
Human cortical areas underlying the perception of optic flow: brain imaging studies.Int Rev Neurobiol. 2000;44:269-92. doi: 10.1016/s0074-7742(08)60746-1. Int Rev Neurobiol. 2000. PMID: 10605650 Review.
-
The representation of the ipsilateral visual field in human cerebral cortex.Proc Natl Acad Sci U S A. 1998 Feb 3;95(3):818-24. doi: 10.1073/pnas.95.3.818. Proc Natl Acad Sci U S A. 1998. PMID: 9448246 Free PMC article. Review.
Cited by
-
The case for primate V3.Proc Biol Sci. 2012 Feb 22;279(1729):625-33. doi: 10.1098/rspb.2011.2048. Epub 2011 Dec 14. Proc Biol Sci. 2012. PMID: 22171081 Free PMC article. Review.
-
Motion opponency in visual cortex.J Neurosci. 1999 Aug 15;19(16):7162-74. doi: 10.1523/JNEUROSCI.19-16-07162.1999. J Neurosci. 1999. PMID: 10436069 Free PMC article.
-
Specializations for chromatic and temporal signals in human visual cortex.J Neurosci. 2005 Mar 30;25(13):3459-68. doi: 10.1523/JNEUROSCI.4206-04.2005. J Neurosci. 2005. PMID: 15800201 Free PMC article.
-
MR tractography with diffusion tensor imaging in clinical routine.Neuroradiology. 2005 May;47(5):334-43. doi: 10.1007/s00234-005-1338-z. Epub 2005 Apr 19. Neuroradiology. 2005. PMID: 15838688
-
The processing of visual shape in the cerebral cortex of human and nonhuman primates: a functional magnetic resonance imaging study.J Neurosci. 2004 Mar 10;24(10):2551-65. doi: 10.1523/JNEUROSCI.3569-03.2004. J Neurosci. 2004. PMID: 15014131 Free PMC article.
References
-
- Adelson EH, Bergen JR. Spatiotemporal energy models for the perception of motion. J Optical Soc Am A. 1985;2:284–299. - PubMed
-
- Albright TD. Form-cue invariant motion processing in primate visual cortex. Science. 1992;255:1141–1143. - PubMed
-
- Allman JM, Kaas JH. A representation of the visual field in the caudal third of the middle temporal gyrus of the owl monkey (Aotus trivirgatus). Brain Res. 1971;31:85–105. - PubMed
-
- Anderson SJ, Holliday IE, Singh KD, Harding GFA. Localization and functional analysis of human cortical area V5 using magneto-encephalography. Proc R Soc Lond [Biol] 1996;263:423–431. - PubMed
-
- Bandettini PA, Jesmanowicz A, Wong EC, Hyde JS. Processing strategies for time-course data sets in functional MRI of the human brain. Magn Reson Med. 1993;30:161–173. - PubMed
Publication types
MeSH terms
Grants and funding
LinkOut - more resources
Full Text Sources