. 1998 May 15;18(10):3955-66.
doi: 10.1523/JNEUROSCI.18-10-03955.1998.

Response classes in the dorsal cochlear nucleus and its output tract in the chloralose-anesthetized cat

Affiliations

Response classes in the dorsal cochlear nucleus and its output tract in the chloralose-anesthetized cat

P X Joris. J Neurosci. .

Abstract

Neurons in the dorsal cochlear nucleus (DCN) can be classified into three major physiological classes on the basis of responses to pure tone and broadband noise stimuli. A circuit diagram that associates these classes with different cell types has been proposed. According to this proposal, type II cells are inhibitory interneurons that respond well to tones and poorly to broadband noise, type IV cells are projection neurons with the opposite behavior, and type III cells are an inhomogeneous class with intermediate properties. To test the associations proposed, I compared the response type distribution in the DCN with its output tract, the dorsal acoustic stria (DAS), in chloralose-anesthetized cats. Axonal recordings in the DAS showed type III and IV responses as in DCN, but no type II responses. Compared with reports in decerebrate animals, fewer type IV neurons were encountered having sustained inhibition that generated strongly nonmonotonic responses to tones in both DCN and DAS. The presence of type II responses in the nucleus, but not in the output tract, offers strong support for the proposed association with DCN interneurons. On the other hand, the distinction between type III and IV responses needs refinement because the differences are only graded and because both types of responses occur in DAS, which shows that they are both associated with projection neurons.


Figures

Fig. 1.
Fig. 1.
Examples of the three main DCN response types. Data are plotted as response maps (top panels) and in a 3-D format (bottom panels). The type III and type IV units were obtained in the same animal. Horizontal arrows on ordinate of top panels show spontaneous rate (SR). Symbols (inset onright) for different sound pressure levels (SPLs) apply to all top panels. Stimulus parameters (number of presentations × stimulus duration/repetition interval): 10 × 100/500 msec. The characteristic frequency (CF) was 7.5 kHz for A andB and 7 kHz for C.
Fig. 2.
Fig. 2.
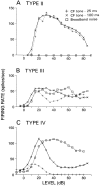
Representative rate-level functions for types II, III, IV. Relative noise ratios (ρ, defined in Results) were 0.002, 1.03, and 0.99, respectively. Stimulus parameters: 40 × 100/500 msec for noise (□), 50 × 100/500 msec for long tone bursts (×), 200 × 25/100 msec for short tone bursts (+). Tone bursts were at the CF (in kilohertz) of each cell; A, 9.5;B, 15.3; C, 11.6.
Fig. 3.
Fig. 3.
Decision tree for classification of cells on the basis of response to tones and broadband noise. The two main branch points correspond to the two main criteria used: nonmonotonicity and relative response to noise. Number and percentage of cells in each branch are indicated. Dashed lines and criterion on theright indicate inhomogeneities in the resulting classes revealed by SR.
Fig. 4.
Fig. 4.
Examples of responses inconsistent with general properties of their class. A, B, Two cells that were classified as type IV based on their nonmonotonic response to long (100 msec) CF tones (×), but that are more consistent with type II because of the absence of SR and the nearly absent response to noise (▪ indicates that noise stimulus was prewhitened). C, D, Two cells classified as type II based on their monotonic response to long duration tones and low relative noise response ρ (RNR). Note nonmonotonicity of response in D to short (25 msec, +) CF tones. CFs (kilohertz) were A, 4.75;B, 38.3; C, 13; D, 33. Stimulus parameters are as in Figure 2. For B, an attenuator setting of 100 dB corresponds to a noise level of 81 dB.
Fig. 5.
Fig. 5.
PSTHs of type II cells to 25 msec tone bursts at CF (100 msec interstimulus interval). CFs and SPLs were (A) 38.3 kHz, 65 dB, (B) 4.5 kHz, 75 dB, (C) 9.5 kHz, 80 dB, (D) 9.5 kHz, 45 dB, (E) 8.6 kHz, 80 dB, and (F) 8.5 kHz, 75 dB. The number of repetitions was 300 (B, F) or 200 (A, C–E); number of bins = 200.
Fig. 6.
Fig. 6.
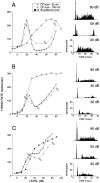
Examples of rate-level functions to tones and noise for three Oc units recorded in the DAS. PSTHs for 25 msec tone bursts are shown in the right column at two SPLs (arrows). The PSTHs in each panel have the same ordinate scale and number of bins (200). CFs were (A) 4.8 kHz, (B) 23.8 kHz, and (C) 16 kHz.
Fig. 7.
Fig. 7.
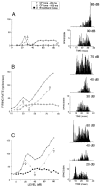
Rate-level functions to tones and noise of three units, recorded in the DAS of one animal, which illustrate similarities between type III (C) and type IV (A, B) responses. Format as in Figure 6. PSTHs in the right column are for the firing rate maxima obtained at a low SPL and at the highest SPL, and for the trough in between (arrows). CFs were (A) 22.8 kHz, (B) 14.7 kHz, and (C) 4.3 kHz.
Fig. 8.
Fig. 8.
Rate-level functions to tones and noise of three unusual units recorded in the DAS (see Results). Format as in Figure 6. CFs were (A) 1.1 kHz, (B) 1.45 kHz, and (C) 9.6 kHz.
Fig. 9.
Fig. 9.
Relationship of maximal response (raw firing rate) to broadband noise and CF tones. Dashed line indicates equality of response; solid line indicates ρ criterion of 0.3. Dotted lines join data points for short and long tone bursts if both were available for the same cell. Total number of cells = 189. A, Oc(n = 11 cells) and type II cells (n = 29). B, Type III cells (64 in DCN, 23 in DAS). Average rates (spikes per second): tones 144 (n = 127), broadband noise 126 (n = 104). C, Type IV cells (43 in DCN, 19 in DAS). Average rates: tones 126 (n = 73), broadband noise 177 (n = 62).
Fig. 10.
Fig. 10.
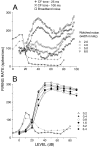
Responses of type IV cells, recorded in DAS of one animal, to CF tones and broadband and notched noise. Noise bandwidth was 40 kHz, and notch bandwidth was varied as indicated by the symbol caption, with a nominal depth of ≥100 dB and slopes of several thousand dB/octave. CFs were 29 kHz (A) and 9 kHz (B). ForA, an attenuator setting of 100 dB corresponds to a noise level of 87 dB.

Similar articles

Cited by

References

    1. Adams JC. Single unit studies on the dorsal and intermediate acoustic striae. J Comp Neurol. 1976;170:97–106. - PubMed
    1. Adams JC, Warr WB. Origins of axons in the cat’s acoustic striae determined by injection of horseradish peroxidase into severed tracts. J Comp Neurol. 1976;170:107–122. - PubMed
    1. Arle JE, Kim DO. Simulations of cochlear nucleus neural circuitry: excitatory-inhibitory response-area types I–IV. J Acoust Soc Am. 1991;90:3106–3121. - PubMed
    1. Chan JCK, Musicant A, Hind JE. An insert earphone system for delivery of spectrally-shaped signals for physiological studies. J Acoust Soc Am. 1993;93:1496–1501. - PubMed
    1. Davis KA, Ding J, Benson TE, Voigt HF. Response properties of units in the dorsal cochlear nucleus of unanesthetized decerebrate gerbil. J Neurophysiol. 1996;75:1411–1431. - PubMed

Publication types

LinkOut - more resources