. 1998 May 1;12(9):1304-14.
doi: 10.1101/gad.12.9.1304.

Defects in regulation of apoptosis in caspase-2-deficient mice

Affiliations

Defects in regulation of apoptosis in caspase-2-deficient mice

L Bergeron et al. Genes Dev. .

Abstract

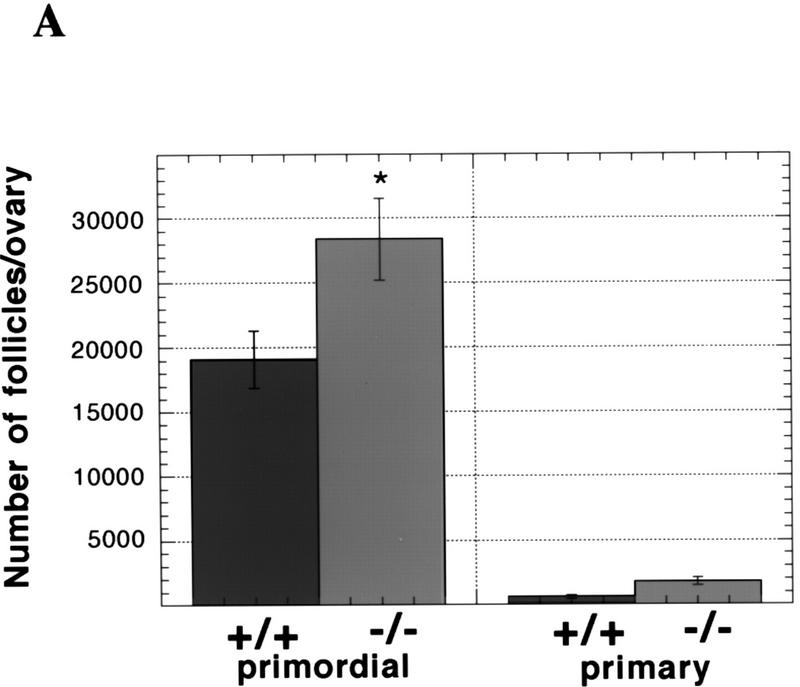
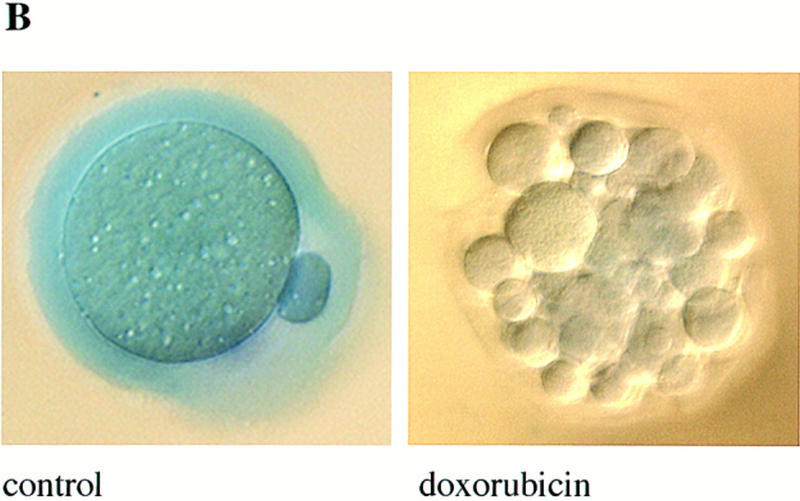
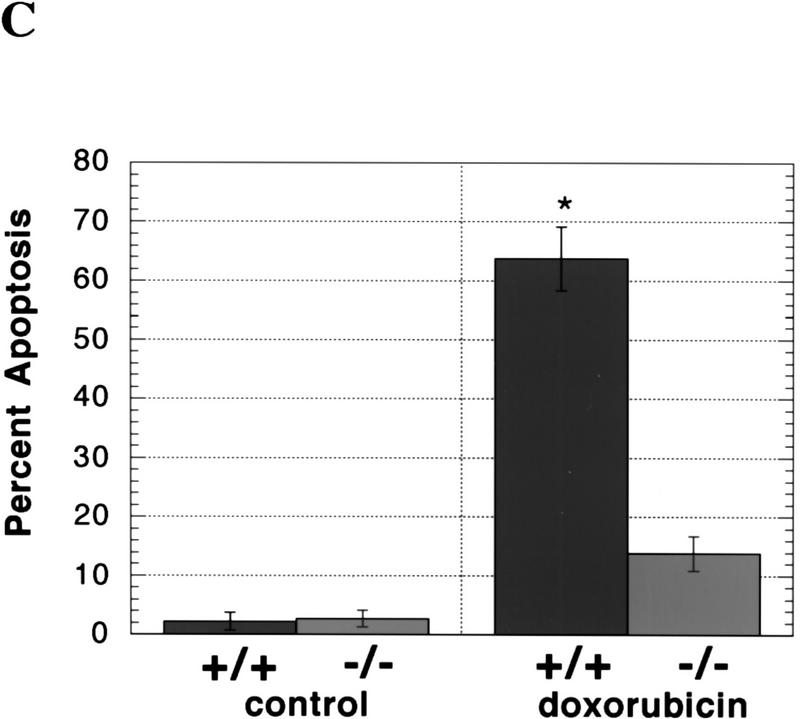
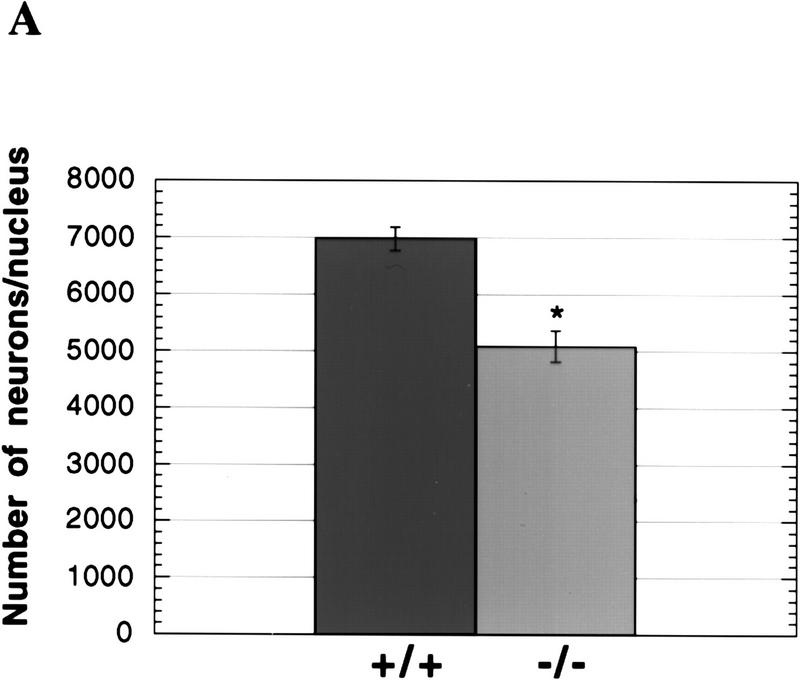
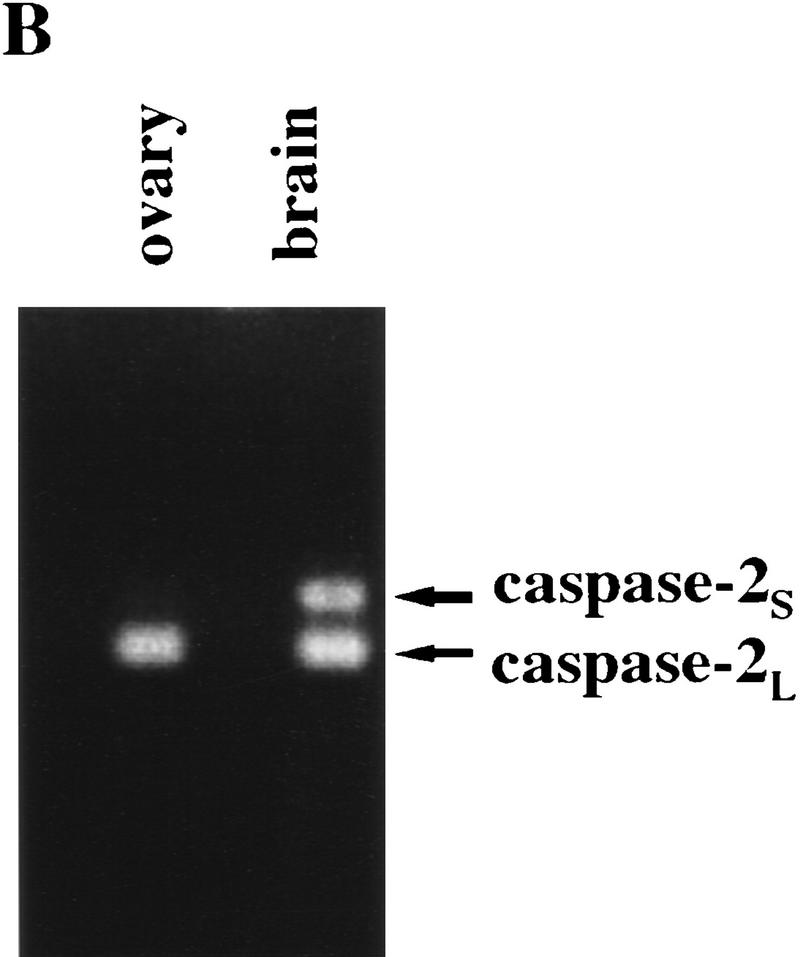
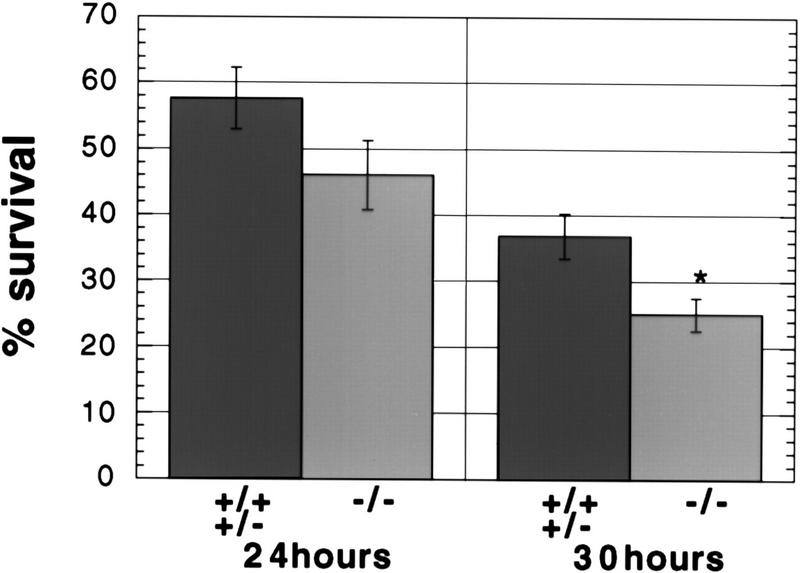
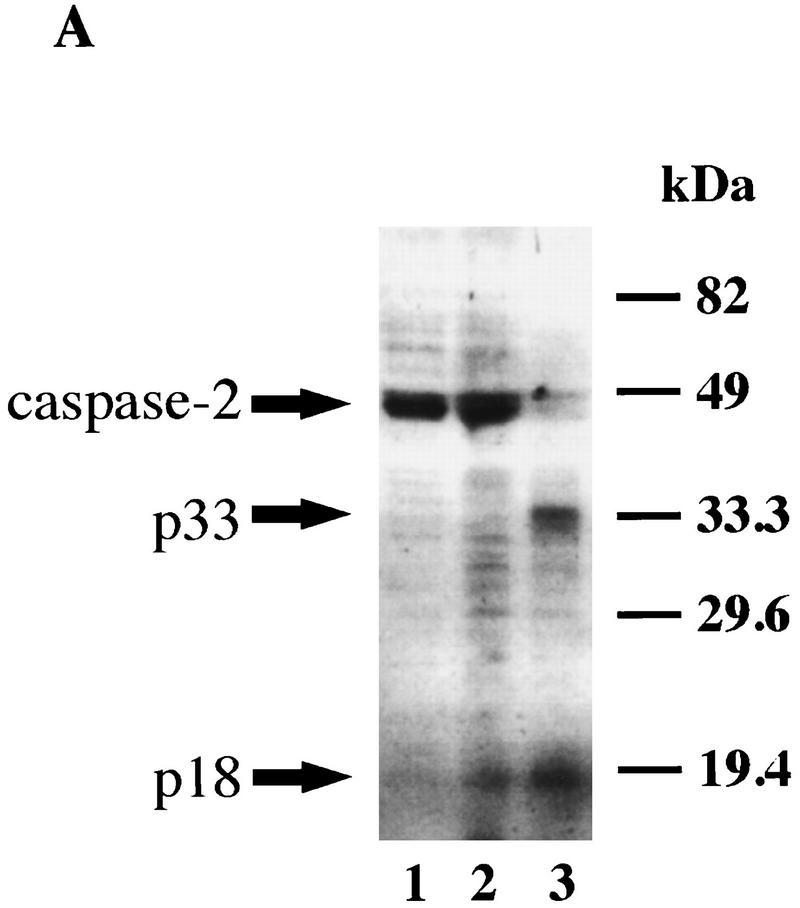
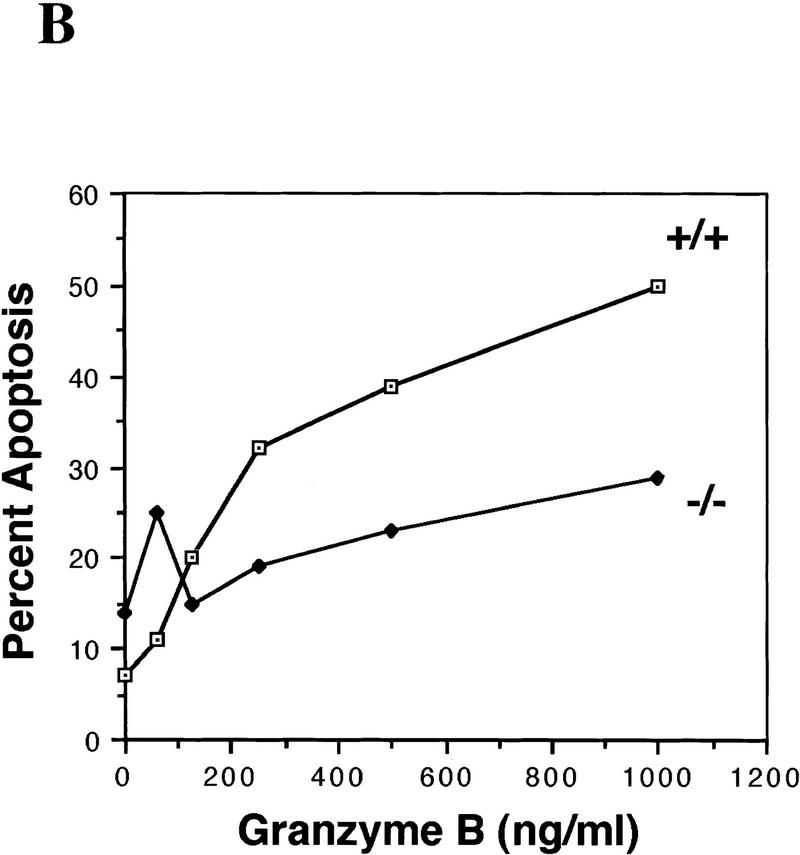
During embryonic development, a large number of cells die naturally to shape the new organism. Members of the caspase family of proteases are essential intracellular death effectors. Herein, we generated caspase-2-deficient mice to evaluate the requirement for this enzyme in various paradigms of apoptosis. Excess numbers of germ cells were endowed in ovaries of mutant mice and the oocytes were found to be resistant to cell death following exposure to chemotherapeutic drugs. Apoptosis mediated by granzyme B and perforin was defective in caspase-2-deficient B lymphoblasts. In contrast, cell death of motor neurons during development was accelerated in caspase-2-deficient mice. In addition, caspase-2-deficient sympathetic neurons underwent apoptosis more effectively than wild-type neurons when deprived of NGF. Thus, caspase-2 acts both as a positive and negative cell death effector, depending upon cell lineage and stage of development.


Figures

Figure 1
Figure 1
Targeted disruption of the caspase-2 gene. (A) The structure of the 3′ end of the mouse caspase-2 gene is depicted. The last four exons are shown as boxes, and the nucleotides are numbered starting from the ATG translation initiation codon. The enzymatic active site pentapeptide domain QACRG is indicated. The differential splicing events that produce two messages encoding the short or long form of caspase-2 are indicated. The position of the probe used for the genomic Southern blot analysis is shown. (B) RT–PCR analysis of spleen mRNA for caspase-2-deficient and wild-type mice. Sequences amplified are indicated at the top. A 300-bp fragment from actin mRNA was amplified as a control, and the caspase-2 cDNA sequence was amplified from nucleotide 901 to 1079 within the active site or from nucleotide 181 to 598 upstream of the active site. The positive control is a fragment amplified from a cloned caspase-2 cDNA; the negative control is a PCR reaction performed without the addition of template cDNA. The sizes of the amplified fragments are indicated at right. (C,D) Immunoblot analysis of tissues from wild-type and mutant mice. Immunoblot analysis of adult (C) (strain 72) and E11.5 (D) (strain 511) mouse tissues using a rabbit polyclonal antibody raised against the full-length recombinant caspase-2 protein. This antibody cross-reacts with two other unrelated proteins (44 and 33 kD).
Figure 1
Figure 1
Targeted disruption of the caspase-2 gene. (A) The structure of the 3′ end of the mouse caspase-2 gene is depicted. The last four exons are shown as boxes, and the nucleotides are numbered starting from the ATG translation initiation codon. The enzymatic active site pentapeptide domain QACRG is indicated. The differential splicing events that produce two messages encoding the short or long form of caspase-2 are indicated. The position of the probe used for the genomic Southern blot analysis is shown. (B) RT–PCR analysis of spleen mRNA for caspase-2-deficient and wild-type mice. Sequences amplified are indicated at the top. A 300-bp fragment from actin mRNA was amplified as a control, and the caspase-2 cDNA sequence was amplified from nucleotide 901 to 1079 within the active site or from nucleotide 181 to 598 upstream of the active site. The positive control is a fragment amplified from a cloned caspase-2 cDNA; the negative control is a PCR reaction performed without the addition of template cDNA. The sizes of the amplified fragments are indicated at right. (C,D) Immunoblot analysis of tissues from wild-type and mutant mice. Immunoblot analysis of adult (C) (strain 72) and E11.5 (D) (strain 511) mouse tissues using a rabbit polyclonal antibody raised against the full-length recombinant caspase-2 protein. This antibody cross-reacts with two other unrelated proteins (44 and 33 kD).
Figure 2
Figure 2
Germ cells from caspase-2-deficient mice are resistant to developmental and doxorubicin-induced apoptosis. (A) Number of follicles in the neonatal females. Ovaries from 4-day-old females were sectioned and stained with hematoxylin–pycric methyl blue and the number of follicles determined (mean ± s.e.m., n = 4 mice for each group; [(*) P < 0.05 vs. wild-type)]. (B) Morphological changes in wild-type oocytes treated with doxorubicin. Nomarski photomicroscopy of oocytes (magnification, 400×), untreated and treated with 200 nm doxorubicin. (C) Apoptosis in normal and caspase-2-deficient oocytes treated with doxorubicin. Oocytes were collected and cultured without (control) or with 200 nm doxorubicin for 24 hr. Oocytes with an apoptotic morphology were counted. The number of oocytes analyzed in each group were 76 (control +/+); 101 (control −/−); 108 (doxorubicin +/+); 152 (doxorubicin −/−). Both mutant mouse lines were used with the same outcome and results were pooled. The graph indicates the mean  ± s.e.m. (*) P < 0.0001 vs. all other group).
Figure 2
Figure 2
Germ cells from caspase-2-deficient mice are resistant to developmental and doxorubicin-induced apoptosis. (A) Number of follicles in the neonatal females. Ovaries from 4-day-old females were sectioned and stained with hematoxylin–pycric methyl blue and the number of follicles determined (mean ± s.e.m., n = 4 mice for each group; [(*) P < 0.05 vs. wild-type)]. (B) Morphological changes in wild-type oocytes treated with doxorubicin. Nomarski photomicroscopy of oocytes (magnification, 400×), untreated and treated with 200 nm doxorubicin. (C) Apoptosis in normal and caspase-2-deficient oocytes treated with doxorubicin. Oocytes were collected and cultured without (control) or with 200 nm doxorubicin for 24 hr. Oocytes with an apoptotic morphology were counted. The number of oocytes analyzed in each group were 76 (control +/+); 101 (control −/−); 108 (doxorubicin +/+); 152 (doxorubicin −/−). Both mutant mouse lines were used with the same outcome and results were pooled. The graph indicates the mean  ± s.e.m. (*) P < 0.0001 vs. all other group).
Figure 3
Figure 3
Cell death of facial motor neurons during development. (A) Decreased number of neurons in the facial motor nuclei of E19.5 and newborn caspase-2-deficient mice. Coronal serial 5-μm sections were stained with cresyl violet, and the numbers of neurons in every fourth section were recorded. Only neurons with a nucleus were counted. The data are presented as the mean and s.e.m. from 8 wild-type and 10 mutant nuclei from both strains of mutant mice. The data from E19.5 and newborn mice were identical and therefore pooled. Significant differences were assessed using a two-tailed Student’s t-test at a 95% confidence interval. (*) P < 0.0001 vs. wild-type). (B) PCR analysis of caspase-2 isoforms in ovary and brain. Primers complementary to regions in exons VIII and X of caspase-2 cDNA were used to amplify caspase-2L message (167 bp) or caspase-2S message containing exon IX (228 bp).
Figure 3
Figure 3
Cell death of facial motor neurons during development. (A) Decreased number of neurons in the facial motor nuclei of E19.5 and newborn caspase-2-deficient mice. Coronal serial 5-μm sections were stained with cresyl violet, and the numbers of neurons in every fourth section were recorded. Only neurons with a nucleus were counted. The data are presented as the mean and s.e.m. from 8 wild-type and 10 mutant nuclei from both strains of mutant mice. The data from E19.5 and newborn mice were identical and therefore pooled. Significant differences were assessed using a two-tailed Student’s t-test at a 95% confidence interval. (*) P < 0.0001 vs. wild-type). (B) PCR analysis of caspase-2 isoforms in ovary and brain. Primers complementary to regions in exons VIII and X of caspase-2 cDNA were used to amplify caspase-2L message (167 bp) or caspase-2S message containing exon IX (228 bp).
Figure 4
Figure 4
Death of sympathetic neurons deprived of NGF. Neurons from the superior cervical ganglia were cultured in the absence of NGF and surviving neurons were counted after the indicated period of time. After 48 hr NGF deprivation 0%–5% of the cells survived in all cultures. Neurons from individual newborn mice were cultured independently in two wells. The first category (+/−) represents data from one wild-type and three heterozygous mice (n = 7 wells); the second category (−/−) represents data from two caspase-2 mutant littermates (n = 4 wells). The error bars represent the s.e.m.. P = 0.15 at 24 hr considered not significant.P = 0.03 (*) at 30 hr is considered significant.
Figure 5
Figure 5
Role of caspase-2 in ischemic injury. (A) Brain damage as measured by infarct TTC staining of infarct area 24 hr after permanent focal ischemia in wild-type and caspase-2-deficient mice. Infarct area was determined in each of five coronal sections (2 mm) from anterior (2 mm from anterior pole) to posterior (10 mm from anterior pole) as percent of TTC (○) +/+ (n = 6); (•) −/− (n = 8). (B) Immunoblot of caspase-2 from brain hemisphere on the ischemic side (I) or contralateral side (C) after either transient (3 hr ischemia; 6 hr reperfusion) or permanent (24 hr ischemia) occlusion. Ten micrograms of protein was loaded on the gel per lane. Samples from thymus tissues are shown at left as a comparison for the amount of caspase-2 present in brain and thymus.
Figure 5
Figure 5
Role of caspase-2 in ischemic injury. (A) Brain damage as measured by infarct TTC staining of infarct area 24 hr after permanent focal ischemia in wild-type and caspase-2-deficient mice. Infarct area was determined in each of five coronal sections (2 mm) from anterior (2 mm from anterior pole) to posterior (10 mm from anterior pole) as percent of TTC (○) +/+ (n = 6); (•) −/− (n = 8). (B) Immunoblot of caspase-2 from brain hemisphere on the ischemic side (I) or contralateral side (C) after either transient (3 hr ischemia; 6 hr reperfusion) or permanent (24 hr ischemia) occlusion. Ten micrograms of protein was loaded on the gel per lane. Samples from thymus tissues are shown at left as a comparison for the amount of caspase-2 present in brain and thymus.
Figure 6
Figure 6
(A) Caspase-2 is processed in cells during apoptosis mediated by GB. Immunoblot of caspase-2 from HeLa cells untreated (lane 1), treated with 0.2 μg/ml perforin (lane 2), or 0.2 μg/ml perforin and 1 μg/ml GB (lane 3) for 2 hr. (B) caspase-2-deficient B lymphoblasts are partially resistant to apoptosis induced by GB. Splenocytes were treated with 10 μg/ml lipopolysaccharide (LPS) for 3 days. The resulting activated B lymphocytes (lymphoblasts) were cultured in the presence of perforin (0.2 μg/ml) and the indicated concentrations of GB/perforin for 3 hr. Cell death was measured by counting the number of cells with condensed chromatin or fragmented nuclei after Hoechst dye staining. Each experimental point represents a percentage calculated from at least 200 counted cells. The experiment was repeated three times with similar results. Mice from strain 72 were used.
Figure 6
Figure 6
(A) Caspase-2 is processed in cells during apoptosis mediated by GB. Immunoblot of caspase-2 from HeLa cells untreated (lane 1), treated with 0.2 μg/ml perforin (lane 2), or 0.2 μg/ml perforin and 1 μg/ml GB (lane 3) for 2 hr. (B) caspase-2-deficient B lymphoblasts are partially resistant to apoptosis induced by GB. Splenocytes were treated with 10 μg/ml lipopolysaccharide (LPS) for 3 days. The resulting activated B lymphocytes (lymphoblasts) were cultured in the presence of perforin (0.2 μg/ml) and the indicated concentrations of GB/perforin for 3 hr. Cell death was measured by counting the number of cells with condensed chromatin or fragmented nuclei after Hoechst dye staining. Each experimental point represents a percentage calculated from at least 200 counted cells. The experiment was repeated three times with similar results. Mice from strain 72 were used.

Similar articles

Cited by

References

    1. Ashwell KW, Watson CRR. The development of facial motoneurons in the mouse: Neuronal death and the innervation of the facial muscle cells. J Embryol Exp Morphol. 1983;77:117–141. - PubMed
    1. Chinnaiyan AM, Dixit VM. The cell-death machine. Curr Biol. 1996;6:555–562. - PubMed
    1. Darmon AJ, Nicholson DW, Bleackley RC. Activation of the apoptotic protease CPP32 by cytotoxic T-cell-derived granzyme B. Nature. 1995;377:446–448. - PubMed
    1. Deckwerth TL, Johnson Jr EM. Temporal analysis of events associated with programmed cell death (apoptosis) of sympathetic neurons deprived of nerve growth factor. J Cell Biol. 1993;123:1207–1212. - PMC - PubMed
    1. Deshmukh M, Vasilakos J, Deckwerth TL, Lampe PA, Shivers BD, Johnson Jr EM. Genetic and metabolic status of NGF-deprived sympathetic neurons saved by an inhibitor of ICE family proteases. J Cell Biol. 1996;135:1341–1354. - PMC - PubMed

Publication types

MeSH terms

LinkOut - more resources