. 1998 May 1;12(9):1381-9.
doi: 10.1101/gad.12.9.1381.

Suppression of crossing-over by DNA methylation in Ascobolus

Affiliations

Suppression of crossing-over by DNA methylation in Ascobolus

L Maloisel et al. Genes Dev. .

Abstract

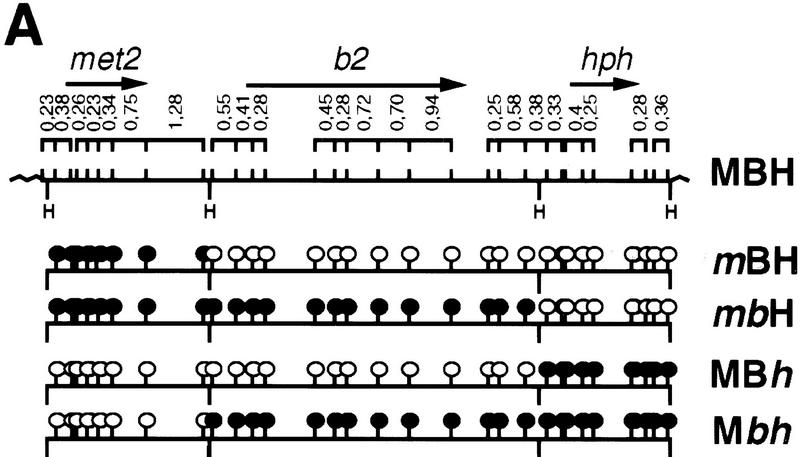
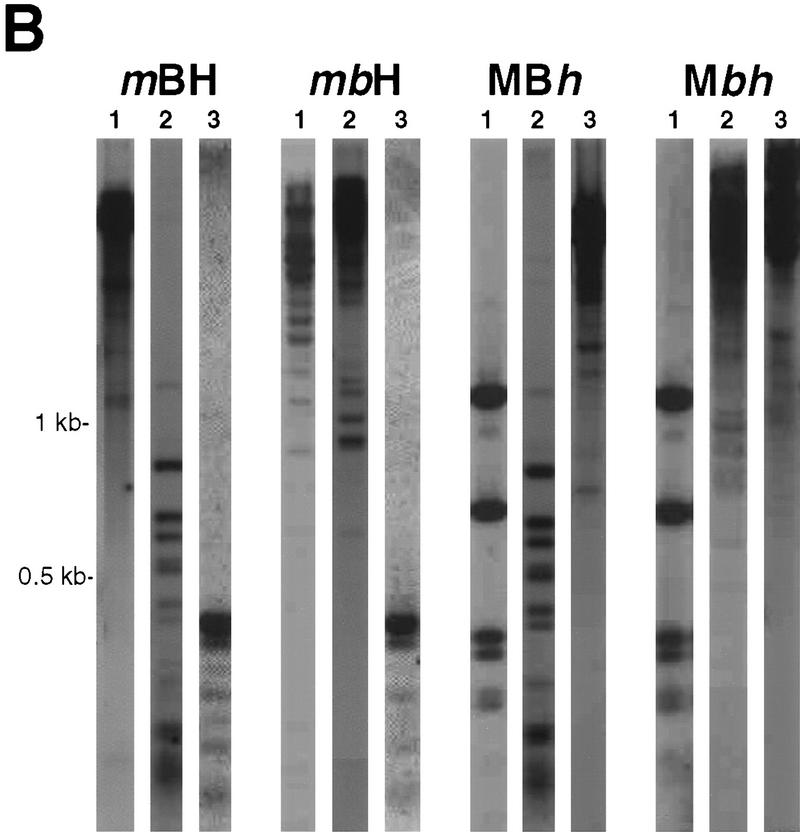
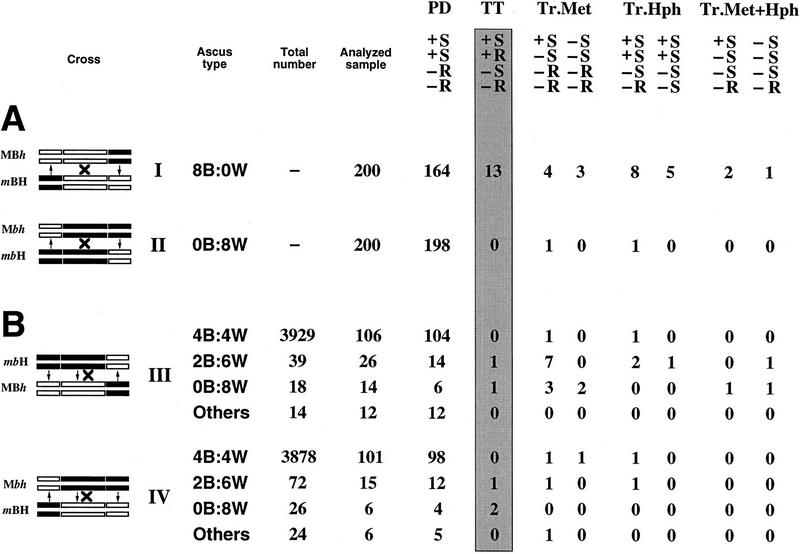
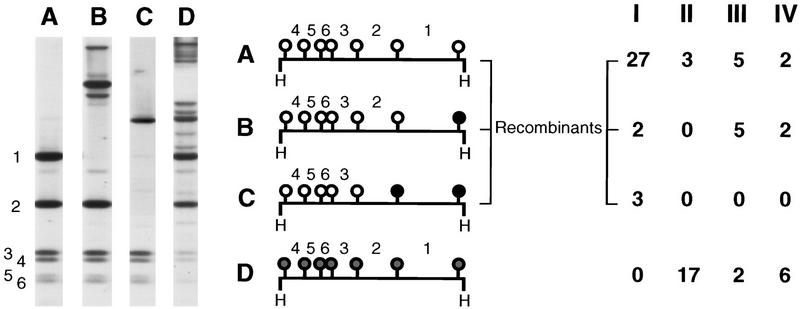
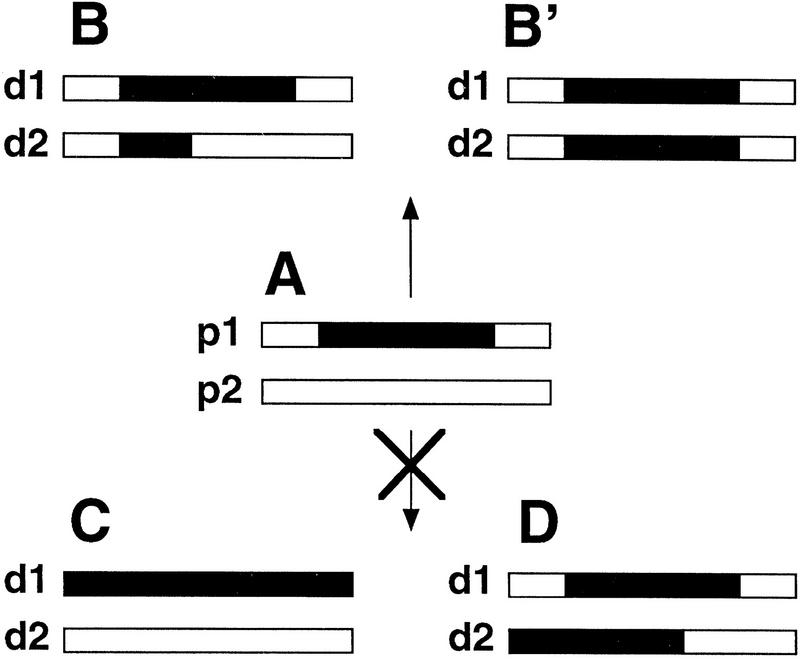
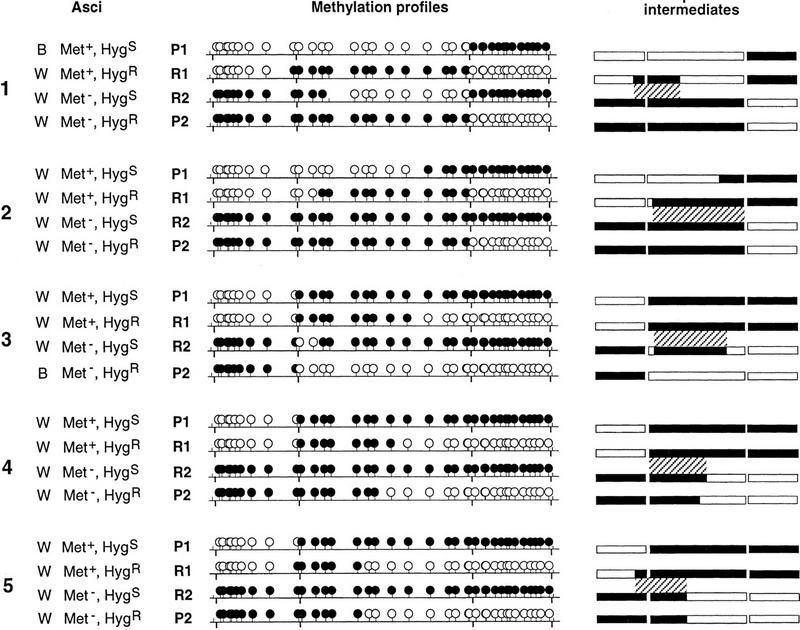
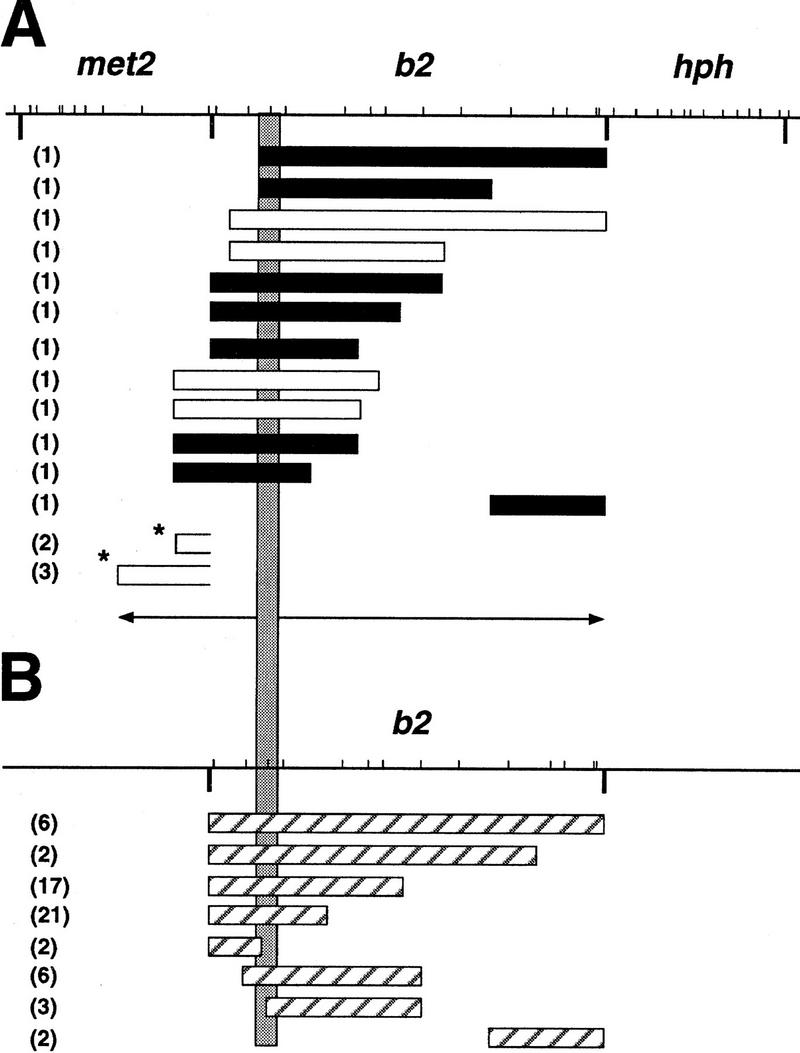
Homologous recombination between dispersed DNA repeats creates chromosomal rearrangements that are deleterious to the genome. The methylation associated with DNA repeats in many eukaryotes might serve to inhibit homologous recombination and play a role in preserving genome integrity. We have tested the hypothesis that DNA methylation suppresses meiotic recombination in the fungus Ascobolus immersus. The natural process of methylation-induced premeiotically (MIP) was used to methylate the b2 spore color gene, a 7.5-kb chromosomal recombination hot spot. The frequency of crossing-over between two markers flanking b2 was reduced several hundredfold when b2 was methylated on the two homologs. This demonstrates that DNA methylation strongly inhibits homologous recombination. When b2 was methylated on one homolog only, crossing-over was still reduced 50-fold, indicating that the effect of methylation cannot be limited to the blocking of initiation of recombination on the methylated homolog. On the basis of these and other observations, we propose that DNA methylation perturbs pairing between the two intact homologs before recombination initiation and/or impairs the normal processing of recombination intermediates.


Figures

Figure 1
Figure 1
HpaII restriction map of the met2–b2–hph transgenic locus and DNA methylation profiles. (A) The MBH strain is the initial transformant carrying the transgenic locus. The three marker genes are each contained within a HindIII fragment (H). ORFs are indicated by arrows. Only HpaII sites bordering restriction fragments >200 bp are indicated (bars). The methylation status of the HpaII sites (sequence CCGG) present in the transgene is indicated [○ (unmethylated) or • (methylated)] for the four different strains derived from the MBH initial strain. (B) HpaII restriction profiles revealed by Southern blot analyses using a met2 probe (lane 1), a b2 probe (lane 2), and a hph probe (lane 3) are shown for the four progeny strains. HpaII sites are not cut by the enzyme when methylated.
Figure 1
Figure 1
HpaII restriction map of the met2–b2–hph transgenic locus and DNA methylation profiles. (A) The MBH strain is the initial transformant carrying the transgenic locus. The three marker genes are each contained within a HindIII fragment (H). ORFs are indicated by arrows. Only HpaII sites bordering restriction fragments >200 bp are indicated (bars). The methylation status of the HpaII sites (sequence CCGG) present in the transgene is indicated [○ (unmethylated) or • (methylated)] for the four different strains derived from the MBH initial strain. (B) HpaII restriction profiles revealed by Southern blot analyses using a met2 probe (lane 1), a b2 probe (lane 2), and a hph probe (lane 3) are shown for the four progeny strains. HpaII sites are not cut by the enzyme when methylated.
Figure 2
Figure 2
Ascus analysis in crosses I to IV. (A) Crosses I (MBh × mBH) and II (Mbh × mbH). For each cross, the three marker genes are symbolized on the four chromatids at meiosis I by white rectangles when unmodified or black rectangles when methylated and silenced. Asci of the progeny are indicated by their spore color phenotype (B, brown; W, white). In crosses I and II, they were composed exclusively (several thousand asci scored) of 8B:0W and 0B:8W asci, respectively. Because meiosis is followed by one cell division before ascospore formation, asci contain four pairs of spores that correspond to the four meiotic products. Segregation of the two flanking markers met2 and hph in the different types of asci is shown (+: Met+; −: Met; S: HygS; R: HygR). Parental ditype asci (PD), which reflect an absence of events, are the most frequently observed. Crossing-over, symbolized by crosses (left), are detected because they lead to tetratype asci (TT, shaded rectangle). Three additional classes of asci were observed as the result of methylation transfer (↑, ↓ at left) from the methylated parental allele to the previously active and unmethylated parental met2 allele (Tr.Met) and/or hph allele (Tr.Hph and Tr.Met+Hph). (B) Crosses III (mbH × MBh) and IV (Mbh × mBH). These crosses, which involve one methylated allele and one unmethylated allele of b2, can give rise to asci showing a transfer of methylation at b2 as well as at the two flanking markers. Methylation transfer at b2 leads to three classes of asci with less than four brown spores (2B:6W, 0B:8W, and Others). (Others) Asci with pink spores indicative of partial inactivation (Colot et al. 1996). A total of 4000 asci were scored in each cross.
Figure 3
Figure 3
Methylation pattern of the met2 marker of Met+, HygR strains. DNA was digested with the enzyme HpaII. Southern blots were hybridized with the met2 HindIII fragment. The HpaII sites are indicated by solid circles when fully methylated, shaded circles when partially methylated, and an open circles when unmethylated. HpaII fragments are numbered according to their size. The Roman numerals (I–IV) heading the columns (right), refer to the four genetic crosses in Fig. 2. Four distinct classes of methylation patterns (A,B,C,D) were observed. Within each class, all the strains analyzed exhibited a methylation pattern identical to that examplified in the figure, except for class B. Classes A, B, and C are all indicative of crossing-over. In class A, there was no methylation at any of the met2 restriction sites tested. In class B, there was also no methylation, except at the rightmost HpaII site. Methylation of this site leads to the loss of the HpaII fragment 1. In cross I, where b2 is unmethylated, this fragment was replaced by one fragment 120 bp longer (not shown). In crosses III and IV, it was replaced by various fragments of higher molecular mass, depending on the methylation status of the neighboring HpaII sites within b2 (one example is shown). In class C, the two rightmost HpaII sites were methylated. This led to the loss of HpaII fragments 1 and 2 and to the appearance of a unique fragment of higher molecular mass. Methylation in classes B and C is restricted to the region closest to b2, as expected if they result from events initiated in the b2 interval and propagating in the direction of met2 (see paragraph on methylation transfers; Colot et al. 1996). Class D shows partial methylation of every met2 HpaII site corresponding to the reversion of silencing of the met2 marker.
Figure 4
Figure 4
Properties of methylation transfer. Each pair of rectangles represents two allelic regions. Parental DNAs are named p1 and p2. (A) The p1 parental DNA displays methylation (black portion), the p2 parental DNA is unmethylated. The corresponding descendant DNAs after meiosis are named d1 and d2. Methylation transfers are characterized by the appearance of methylated segments of variable length in the d2 DNA issued from p2. This methylated segments always extends within a region allelic to that which was methylated in p1 (B,B′). Methylation never spreads in cis (C), nor is transferred to nonallelic regions (D) (from Colot et al. 1996; this study).
Figure 5
Figure 5
Methylation transfer events associated with crossing-over. The five asci from cross III (asci 1 and 2) and cross IV (asci 3, 4, and 5) showing a crossing-over event (Fig. 2B) are represented (left) with the phenotypes of their four meiotic products. The two parental products are designated P1 and P2; the two recombinant products are designated R1 and R2. The methylation profiles of the four meiotic products of each ascus were determined using the HpaII restriction enzyme. (•) Methylated HpaII sites; (○) unmethylated. The HindIII sites separating the three genes are indicated below the horizontal bar. (Right) Proposed intermediates after methylation transfer. met2, b2, and hph are represented by rectangles; methylated regions are in black and unmethylated regions are in white. For the sake of simplicity, crossing-over was dissociated from transfer of methylation in these drawings. The final products are obtained by performing a reciprocal exchange within the hatched region between the two homologs, which will recombine. This hatched region defines the length of the methylation transfer together with the region where crossing-over must have occurred. Crossing-over outside of this region would have given patched methylation profiles. Methylation transfer involves one (asci 1 and 3) or both (asci 2, 4, and 5) homologous chromatids.
Figure 6
Figure 6
(A) Bidirectional polarity of methylation transfer events. The shaded vertical rectangle defines the region of b2 in which 73 of 76 methylation transfers shown could have been initiated. The bidirectional polarity is suggested by the two opposite arrows. The HpaII restriction map of the met2–b2–hph transgene is at the top (bars). The HindIII sites separating the three genes are indicated below the horizontal bar. Rectangles show the different lengths of methylation transfer observed. Solid rectangles correspond to methylation transfers shown in Fig. 5; open rectangles indicate methylation transfers observed in randomly selected Met+, HygR recombinants (Fig. 3) and correspond to profiles A and B from cross IV. [The extent of the methylation transfer cannot be deduced from the Met+, HygR recombinants in cross III (Fig. 5).] Transfers indicated by asterisks correspond to profiles B and C from cross I and are limited to met2 because b2 was not methylated in this cross. However, they can result from molecular events initiated in b2 and propagating leftward (see Discussion). This is suggested by the right opening of the rectangles. (B) Hatched rectangles show the methylation transfers previously observed at the resident b2 gene, which is devoid of the met2 and hph flanking markers (Colot et al. 1996). For each event, the number of occurrence is given in parenthesis.

Similar articles

Cited by

References

    1. Assaad FF, Signer ER. Somatic and germinal recombination of a direct repeat in Arabidopsis. Genetics. 1992;132:553–566. - PMC - PubMed
    1. Barlow DP. Methylation and imprinting: From host defense to gene regulation? Science. 1993;260:309–310. - PubMed
    1. Bennetzen JL, Schrick KS, Springer PS, Brown WE, SanMiguel P. Active maize genes are unmodified and flanked by diverse classes of modified, highly repetitive DNA. Genome. 1994;37:565–576. - PubMed
    1. Bestor TH, Tycko B. Creation of genomic methylation patterns. Nature Genet. 1996;12:363–367. - PubMed
    1. Bishop DK, Park D, Xu L, Kleckner N. DMC1: A meiosis-specific yeast homolog of E. coli recA required for meiotic recombination, synaptonemal complex formation and cell cycle progression. Cell. 1992;69:439–456. - PubMed

Publication types

LinkOut - more resources