. 1998 May;66(5):1953-61.
doi: 10.1128/IAI.66.5.1953-1961.1998.

Cloning and sequencing of a Candida albicans catalase gene and effects of disruption of this gene

Affiliations

Cloning and sequencing of a Candida albicans catalase gene and effects of disruption of this gene

D R Wysong et al. Infect Immun. 1998 May.

Abstract

Catalase plays a key role as an antioxidant, protecting aerobic organisms from the toxic effects of hydrogen peroxide, and in some cases has been postulated to be a virulence factor. To help elucidate the function of catalase in Candida albicans, a single C. albicans-derived catalase gene, designated CAT1, was isolated and cloned. Degenerate PCR primers based on highly conserved areas of other fungal catalase genes were used to amplify a 411-bp product from genomic DNA of C. albicans ATCC 10261. By using this product as a probe, catalase clones were isolated from genomic libraries of C. albicans. Nucleotide sequence analysis revealed an open reading frame encoding a protein of 487 amino acid residues. Construction of a CAT1-deficient mutant was achieved by using the Ura-blaster technique for sequential disruption of multiple alleles by integrative transformation using URA3 as a selectable marker. Resulting mutants exhibited normal morphology and comparable growth rates of both yeast and mycelial forms. Enzymatic analysis revealed an abundance of catalase in the wild-type strain but decreasing catalase activity in heterozygous mutants and no detectable catalase in a homozygous null mutant. In vitro assays showed the mutant strains to be more sensitive to damage by both neutrophils and concentrations of exogenous peroxide that were sublethal for the parental strain. Compared to the parental strain, the homozygous null mutant strain was far less virulent for mice in an intravenous infection model of disseminated candidiasis. Definitive linkage of CAT1 with virulence would require restoration of activity by reintroduction of the gene into mutants. However, initial results in mice, taken together with the enhanced susceptibility of catalase-deficient hyphae to damage by human neutrophils, suggest that catalase may enhance the pathogenicity of C. albicans.


Figures
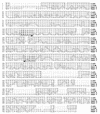
FIG. 1
FIG. 1
Alignment of the deduced amino acid sequences of the C. albicans catalase (C. alb.) with the catalases of C. tropicalis (C. trop.) and S. cerevisiae (Yeast A and Yeast T). Identical residues are boxed. Dashes indicate gaps in the amino acid sequence when compared to other sequences. Amino acids in boldface type indicate regions used to design degenerate primers. Arrows indicate directions of degenerate PCR primers. Alignment was generated by using MegAlign (DNAStar).
FIG. 2
FIG. 2
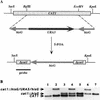
Sequential disruption of the CAT1 gene of C. albicans by using the Ura-blaster technique. (A) Partial restriction map of the CAT1 allele before and after regeneration of the ura3 genetic marker by 5-FOA selection. The plasmid used for the gene disruption construct encompassed the entire 2,036 bp containing the entire 1,461-kb CAT1 ORF, indicated by the boxed and shaded rectangle at the top. Restriction sites BglII, EcoRV, KpnI, and SacI are indicated. A 1,351-bp BglII-EcoRV fragment of CAT1 was replaced by the his-URA-his construct; this is shown below the CAT1 ORF. The his-URA-his construct consisted of URA3 flanked by a hisG insert at each end. Beneath this construct are shown the final transformants selected by 5-FOA, which contained the disrupted CAT1 gene, missing the 1,351-bp BglII-EcoRV fragment and retaining one copy of hisG (1,149 bp) flanked by small fragments of the disrupted CAT1 gene (Δcat1). The solid black line at the bottom represents the location of a portion of CAT1 used as a 32P-labeled probe for Southern analysis. It is important to note that the lengths of each of the fragments are not drawn to scale. (B) Southern analysis of the parental, heterozygous, and homozygous mutants after digestion with KpnI/SacI, followed by hybridization using a fragment of CAT1 as a probe. Lanes: 1, CAI4 parental DNA; 2 to 7, pre- and post-5-FOA isolates after the first (lanes 2 and 3), second (lanes 4 and 5), and third (lanes 6 and 7) rounds of transformation. Not shown in this figure, Southern analysis after hybridization with a hisG probe confirmed that hisG was present in each of the cat1::hisG bands (lanes 3 to 7) and cat1::hisG/URA3/hisG bands (lanes 2, 4, and 6) but not with any of the CAT1 bands (lanes 1 to 5).
FIG. 3
FIG. 3
Northern blot analysis of CAT1 expression in strain CAI4 and in CAT1 mutants. All isolates were grown as yeast cells in YEPD medium at 30°C. Total RNA was extracted from cultures, and 10 μg of each sample was analyzed by Northern blot hybridization. (A) CAT1 expression was detected by using a 1,156-bp EcoRI fragment of CAT1 as a hybridization probe. Lanes: 1, CAI4 parental DNA; 2 and 3, pre- and post-5-FOA isolates of the heterozygous mutant after first transformation; 4 and 5, pre- and post-5-FOA isolates of the heterozygous mutant after second transformation; 6 and 7, pre- and post-5-FOA isolates of the homozygous mutant after third transformation. The sizes (in kilobases) and positions of electrophoretic RNA standards are indicated on the right. (B) Control hybridization using a 1.4-kb ACT1 fragment from plasmid pLV4 as a probe to demonstrate equal loading in each lane.
FIG. 4
FIG. 4
Electrophoretic karyotypes of C. albicans CAI4, ATCC 10261, and 4918 were probed with the 1,156-bp EcoRI fragment of CAT1. Numbers to the left of the photograph of the ethidium bromide-stained gel (A) indicate the positions of the C. albicans chromosomes. The arrow to the right of the Southern blot (B) indicates the location of chromosome 1.
FIG. 5
FIG. 5
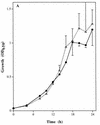
Phenotypic comparisons between the parental strain, SC5314 (•), and the homozygous mutant strain, CADW3 (▵). (A) Both strains were grown in RPMI 1640 medium at 25°C. Growth rates were compared by measuring the optical density at 650 nm (OD650) after 4 and 8 h and then every 2 h up to 24 h. (B) Both strains were grown in RPMI 1640 medium at 37°C. The percentage of organisms exhibiting phase change from yeast to mycelia was determined by microscopic examination after 2, 3, and 4 h of incubation. (C) Sensitivity to H2O2 was measured by incubating yeast-phase organisms from both strains with 0.125 to 4.0 mM H2O2 for 60 min followed by washing of the organisms. The percentage of metabolically active organisms remaining was determined by measuring the absorbance at 450 nm after reduction of XTT, as described in Materials and Methods.
FIG. 5
FIG. 5
Phenotypic comparisons between the parental strain, SC5314 (•), and the homozygous mutant strain, CADW3 (▵). (A) Both strains were grown in RPMI 1640 medium at 25°C. Growth rates were compared by measuring the optical density at 650 nm (OD650) after 4 and 8 h and then every 2 h up to 24 h. (B) Both strains were grown in RPMI 1640 medium at 37°C. The percentage of organisms exhibiting phase change from yeast to mycelia was determined by microscopic examination after 2, 3, and 4 h of incubation. (C) Sensitivity to H2O2 was measured by incubating yeast-phase organisms from both strains with 0.125 to 4.0 mM H2O2 for 60 min followed by washing of the organisms. The percentage of metabolically active organisms remaining was determined by measuring the absorbance at 450 nm after reduction of XTT, as described in Materials and Methods.
FIG. 6
FIG. 6
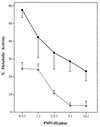
Effect of C. albicans CAT1 deletion on susceptibility to damage by PMNs. Hyphae of both the parent strain, SC5314 (•), and the homozygous mutant strain, CADW3 (▵), were incubated at 37°C for 60 min with PMNs. Percentages of metabolically active hyphae were determined by measuring the absorbance of supernatants at 450 nm after reduction of XTT, as described in Materials and Methods.
FIG. 7
FIG. 7
Virulence of SC5314 and the CAT1 disruptant in an immunocompetent mouse model. Mice (7 to 10 per group) were inoculated with 104, 105, 106, 107, or 108 CFU of the parental strain, SC5314 (solid lines), or the homozygous mutant strain, CADW3 (dashed lines), via the lateral tail vein. The size of the inoculum is indicated at the end of each plotted line. The time of death (days after infection) was recorded. The results of two separate experiments are shown.
FIG. 8
FIG. 8
Clearance of C. albicans from tissue after infection with strain SC5314 (solid lines) or the catalase-deficient mutant, CADW3 (dashed lines). Colony counts were done to determine average numbers of CFU per gram of tissue from the lungs (A), the liver (B), and the kidney (C). Inoculation of mice is described in the legend to Fig. 7. Closed symbols indicate the parental strain, SC5314, while open symbols represent the homozygous mutant strain, CADW3. Inocula consisted of 104 (▴ and ▵), 105 (⧫ and ◊), 106 (• and ○), 107 (▪ and □), and 108 (▾ and ▿) conidia.

Similar articles

Cited by

References

    1. Alani E, Cao L, Kleckner N. A method for gene disruption that allows repeated use of URA3 selection in the construction of multiply disrupted yeast strains. Genetics. 1987;116:541–545. - PMC - PubMed
    1. Beck-Sague C M, Jarvis W R. National nosocomial infections surveillance system. Secular trends in the epidemiology of nosocomial fungal infections in the United States, 1980–1990. J Infect Dis. 1993;167:1247–1251. - PubMed
    1. Bulawa C E, Miller D W, Henry L K, Becker J M. Attenuated virulence of chitin-deficient mutants of Candida albicans. Proc Natl Acad Sci USA. 1995;92:10570–10574. - PMC - PubMed
    1. Cohen G, Rapatz W, Ruiz H. Sequence of the Saccharomyces cerevisiae CTA1 gene and amino acid sequence of catalase A derived from it. Eur J Biochem. 1988;176:159–163. - PubMed
    1. Diamond R D, Clark R A. Damage to Aspergillus fumigatus and Rhizopus oryzae hyphae by oxidative and nonoxidative microbicidal products of human neutrophils in vitro. Infect Immun. 1982;38:487–495. - PMC - PubMed

Publication types

Associated data

LinkOut - more resources