

Expansion of Vgamma9 Vdelta2 T cells is triggered by Francisella tularensis-derived phosphoantigens in tularemia but not after tularemia vaccination
- PMID: 9573096
- PMCID: PMC108170
- DOI: 10.1128/IAI.66.5.2107-2114.1998
Expansion of Vgamma9 Vdelta2 T cells is triggered by Francisella tularensis-derived phosphoantigens in tularemia but not after tularemia vaccination
Abstract
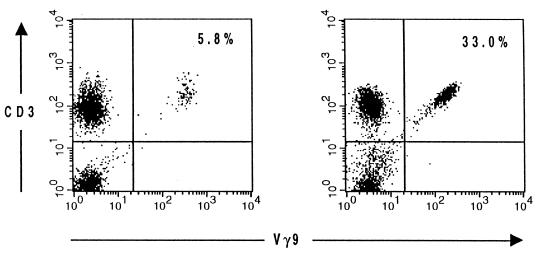
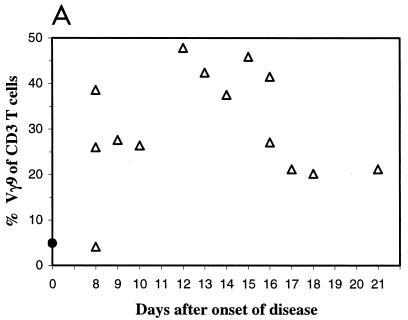
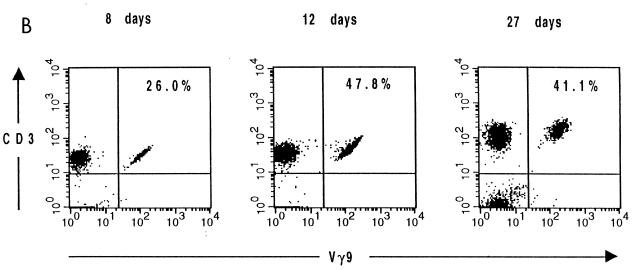
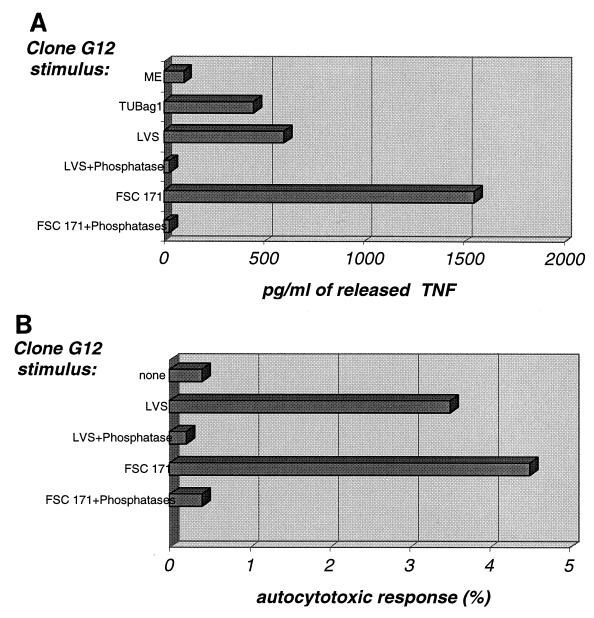
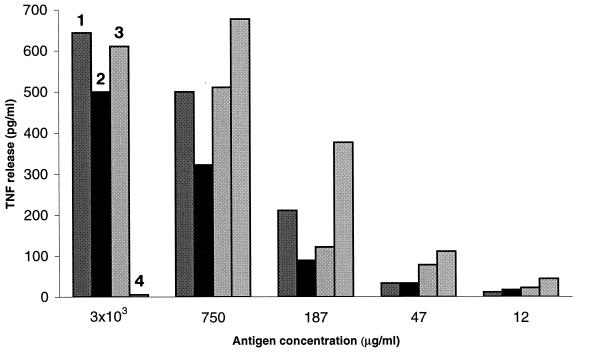
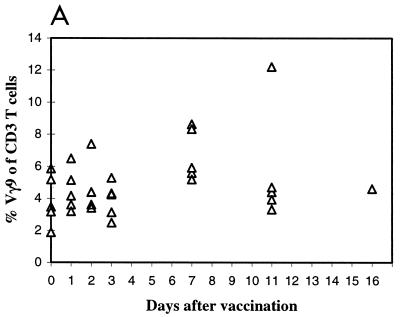
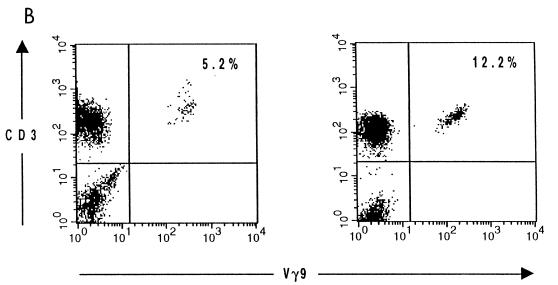
Tularemia is a disease caused by the facultative intracellular bacterium Francisella tularensis. Here we demonstrate that during the first weeks of infection, a significant increase in levels of Vgamma9 Vdelta2 cells occurred in peripheral blood: in 13 patients analyzed 7 to 18 days after the onset of disease, these lymphocytes represented, on average, 30.5% of CD3+ cells and nearly 100% of gammadelta+ T cells. By contrast, after vaccination with the live vaccine strain (LVS) of F. tularensis, only a minor increase occurred. Eleven days after vaccination, gammadelta T cells represented an average of 6.7% and Vgamma9 Vdelta2 cells represented an average of 5.3% of T cells, as in control subjects. Since derivatives of nonpeptidic pyrophosphorylated molecules, referred to as phosphoantigens, are powerful stimuli for Vgamma9 Vdelta2 cells, this observation prompted an investigation of phosphoantigens in F. tularensis strains. The F. tularensis phosphoantigens triggered in vitro a proliferative response of human Vgamma9 Vdelta2 peripheral blood leukocytes as well as a cytotoxic response and tumor necrosis factor release from a Vgamma9 Vdelta2 T-cell clone. Quantitatively similar phosphoantigenic activity was detected in acellular extracts from two clinical isolates (FSC171 and Schu) and from LVS. Taken together, the chemical nature of the stimulus from the clinical isolates and the significant increase in levels of Vgamma9 Vdelta2 cells in peripheral blood of tularemia patients indicate that phosphoantigens produced by virulent strains of F. tularensis trigger in vivo expansion of gammadelta T cells in tularemia.
Figures
Similar articles
-
Peripheral human γδ T cells control growth of both avirulent and highly virulent strains of Francisella tularensis in vitro.Microbes Infect. 2012 Jul;14(7-8):584-9. doi: 10.1016/j.micinf.2012.02.001. Epub 2012 Feb 11. Microbes Infect. 2012. PMID: 22370220
-
Predominance of Vgamma9/Vdelta2 T lymphocytes in the cerebrospinal fluid of children with tuberculous meningitis: reversal after chemotherapy.Mol Med. 1999 May;5(5):301-12. Mol Med. 1999. PMID: 10390546 Free PMC article. Clinical Trial.
-
Patterns of phosphoantigen stimulation of human Vgamma9/Vdelta2 T cell clones include Th0 cytokines.Hum Immunol. 1997 Dec;58(2):70-82. doi: 10.1016/s0198-8859(97)00211-5. Hum Immunol. 1997. PMID: 9475336
-
Nature of protective immunity to Francisella tularensis.Rev Infect Dis. 1989 May-Jun;11(3):440-51. Rev Infect Dis. 1989. PMID: 2665002 Review.
-
Adaptive Immunity to Francisella tularensis and Considerations for Vaccine Development.Front Cell Infect Microbiol. 2018 Apr 6;8:115. doi: 10.3389/fcimb.2018.00115. eCollection 2018. Front Cell Infect Microbiol. 2018. PMID: 29682484 Free PMC article. Review.
Cited by
-
The immune response to Francisella tularensis.Front Microbiol. 2025 Apr 25;16:1549343. doi: 10.3389/fmicb.2025.1549343. eCollection 2025. Front Microbiol. 2025. PMID: 40351308 Free PMC article. Review.
-
Targeting γδ T cells for immunotherapy of HIV disease.Future Virol. 2011 Jan 1;6(1):73-84. doi: 10.2217/FVL.10.78. Future Virol. 2011. PMID: 21339853 Free PMC article.
-
Regulation and function of IL-17A- and IL-22-producing γδ T cells.Cell Mol Life Sci. 2011 Jul;68(14):2371-90. doi: 10.1007/s00018-011-0700-z. Epub 2011 May 15. Cell Mol Life Sci. 2011. PMID: 21573786 Free PMC article. Review.
-
Metabolic engineering of Salmonella vaccine bacteria to boost human Vγ2Vδ2 T cell immunity.J Immunol. 2014 Jul 15;193(2):708-21. doi: 10.4049/jimmunol.1302746. Epub 2014 Jun 18. J Immunol. 2014. PMID: 24943221 Free PMC article.
-
Deep characterization of human γδ T cell subsets defines shared and lineage-specific traits.Front Immunol. 2023 Mar 31;14:1148988. doi: 10.3389/fimmu.2023.1148988. eCollection 2023. Front Immunol. 2023. PMID: 37063856 Free PMC article.
References
-
- Balbi B, Valle M T, Oddera S, Giunti D, Manca F, Rossi G A, Allegra L. T-lymphocytes with gamma delta+ V delta2+ antigen receptors are present in increased proportions in a fraction of patients with tuberculosis or with sarcoidosis. Am Rev Respir Dis. 1993;148:1685–1690. - PubMed
-
- Bukowski J F, Morita C T, Tanaka Y, Bloom B R, Brenner M B, Band H. Vgamma 2 Vdelta 2 TCR-dependent recognition of non-peptide antigens and Daudi cells analyzed by TCR gene transfer. J Immunol. 1995;154:998–1006. - PubMed
-
- Burk M R, Mori L, De Libero G. Human Vγ9-Vδ2 cells are stimulated in a cross-reactive fashion by a variety of phosphorylated metabolites. Eur J Immunol. 1995;25:2052–2058. - PubMed
-
- Burke D S. Immunization against tularemia: analysis of the effectiveness of live Francisella tularensis vaccine in prevention of laboratory-acquired tularemia. J Infect Dis. 1977;135:55–60. - PubMed
Publication types
MeSH terms
Substances
LinkOut - more resources
Full Text Sources
Other Literature Sources
