Comparative Study
. 1998 May;36(5):1318-23.
doi: 10.1128/JCM.36.5.1318-1323.1998.

Computerized analysis of restriction fragment length polymorphism patterns: comparative evaluation of two commercial software packages

Affiliations
Comparative Study

Computerized analysis of restriction fragment length polymorphism patterns: comparative evaluation of two commercial software packages

P Gerner-Smidt et al. J Clin Microbiol. 1998 May.

Abstract

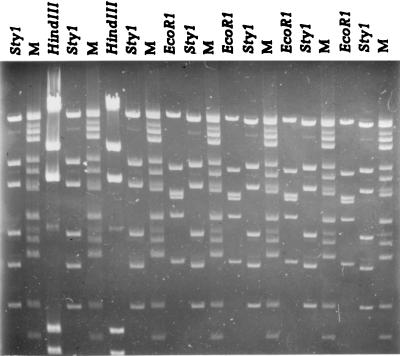
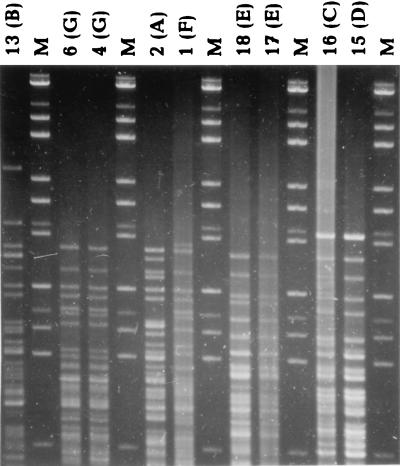
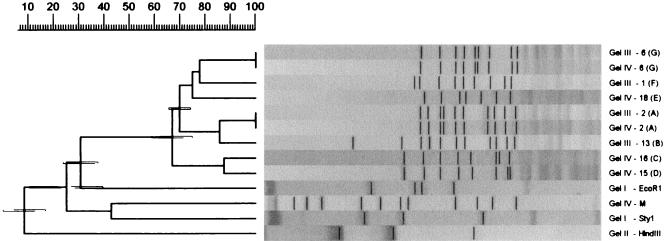
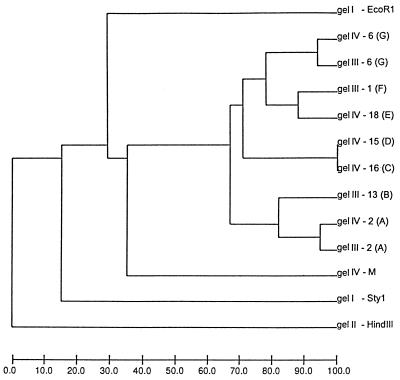
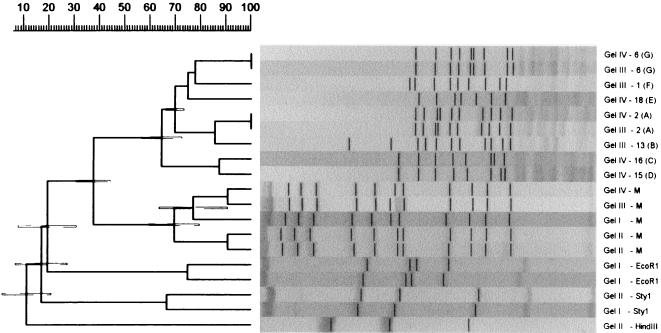
Two computerized restriction fragment length polymorphism pattern analysis systems, the BioImage system and the GelCompar system (Molecular Analyst Fingerprinting Plus in the United States), were compared. The two systems use different approaches to compare patterns from different gels. In GelCompar, a standard reference pattern in one gel is used to normalize subsequent gels containing lanes with the same reference pattern. In BioImage, the molecular sizes of the fragments are calculated from size standards present in each gel. The molecular size estimates obtained with the two systems for 12 restriction fragments of phage lambda were between 97 and 101% of their actual sizes, with a standard deviation of less than 1% of the average estimated size for most fragments. At the window sizes used for analysis, the GelCompar system performed somewhat better than BioImage in identifying visually identical patterns generated by electrophoretic separation of HhaI-restricted DNA of Listeria monocytogenes. Both systems require the user to make critical decisions in the analysis. It is very important to visually verify that the systems are finding all bands in each lane and that no artifacts are being detected; both systems allow manual editing. It is also important to verify results obtained in the pattern matching or clustering portions of the analysis.


Figures

FIG. 1
FIG. 1
A distorted gel (gel II) containing molecular size markers (M) and EcoRI, StyI, and HindIII fragments of phage λ. The distortion was created by overloading the lanes with the HindIII phage λ fragments and by electrophoresing without recirculation of the buffer. The molecular size standard is a mixture of adenovirus type 2 BamHI-EcoRI fragments and StuI phage λ fragments. From the top, the sizes of the fragments are 21.4, 19.0, 14.3, 12.4, 10.7, 7.9, 7.0, 6.2, 5.9, 4.7, 4.3, 4.0, 3.7, and 2.7 kb.
FIG. 2
FIG. 2
HhaI restriction fragments of DNA from isolates of L. monocytogenes (gel IV). The molecular size standards are as described in the legend to Fig. 1. The identification numbers of the L. monocytogenes isolates are indicated at the top with their REA pattern designations in the parentheses. The gel was electrophoresed with recirculation of the running buffer.
FIG. 3
FIG. 3
A GelCompar-generated UPGMA clustering dendrogram with error flags and corresponding normalized restriction profiles. Only visually unique patterns and patterns identified as being different by BioImage (Fig. 4) are shown. Normalization was done using all molecular standards in all gels. The clustering was based on the bands enhanced in the figure. The Dice similarity coefficient was used, and the optimization feature was enabled. On the right, the gel numbers and the sources of the profiles are indicated. The pattern designations of the Listeria restriction profiles are indicated in the parentheses. The scale at the top of the figure shows percent similarity. M, molecular size markers.
FIG. 4
FIG. 4
The BioImage-generated UPGMA clustering dendrogram corresponding to the GelCompar dendrogram shown in Fig. 3. The scale at the bottom of the figure shows percent similarity. M, molecular size markers.
FIG. 5
FIG. 5
A GelCompar-generated UPGMA clustering dendrogram with error flags and corresponding normalized restriction profiles. Normalization was done with only the outermost standards in each gel, and only profiles identified by the software as being different are shown. All parameters and designations used are as described in the legend to Fig. 3. The scale at the top of the figure shows percent similarity. M, molecular size markers.

Comment in

References

    1. Dice L R. Measures of the amount of ecologic association between species. Ecology. 1945;26:297–302.
    1. Graves L M, Swaminathan B. Universal bacterial DNA isolation procedure. In: Persing D H, Smith T F, Tenover F C, White T J, editors. Diagnostic molecular microbiology: principles and applications. Washington, D.C: American Society for Microbiology; 1993. pp. 617–621.
    1. Graves L M, Swaminathan B, Reeves M W, Hunter S B, Weaver R E, Plikaytis B D, Schuchat A. Comparison of ribotyping and multilocus enzyme electrophoresis for subtyping of Listeria monocytogenes isolates. J Clin Microbiol. 1994;32:2936–2943. - PMC - PubMed
    1. Martin C, Ichou M A, Massicot P, Goudeau A, Quentin R. Genetic diversity of Pseudomonas aeroginosa strains isolated from patients with cystic fibrosis revealed by restriction fragment length polymorphism of the rRNA gene region. J Clin Microbiol. 1995;33:1461–1466. - PMC - PubMed
    1. Schmid J, Tay Y P, Wan L, Carr M, Parr D, McKinney W. Evidence for nosocomial transmission of Candida albicans obtained by Ca3 fingerprinting. J Clin Microbiol. 1995;33:1223–1230. - PMC - PubMed

Publication types

MeSH terms

LinkOut - more resources