. 1998 May 12;95(10):5442-7.
doi: 10.1073/pnas.95.10.5442.

Trends in odor intensity for human and electronic noses: relative roles of odorant vapor pressure vs. molecularly specific odorant binding

Affiliations

Trends in odor intensity for human and electronic noses: relative roles of odorant vapor pressure vs. molecularly specific odorant binding

B J Doleman et al. Proc Natl Acad Sci U S A. .

Abstract

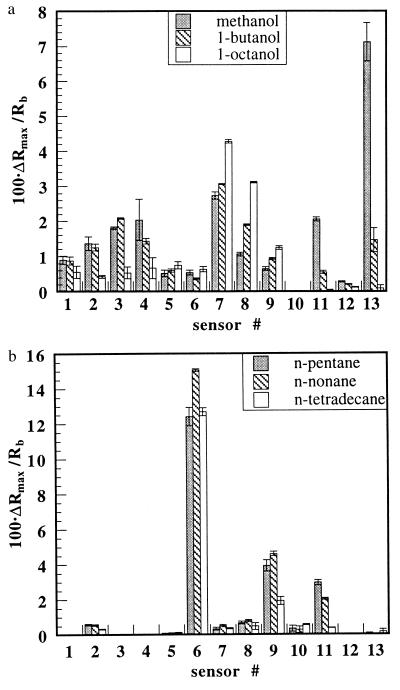
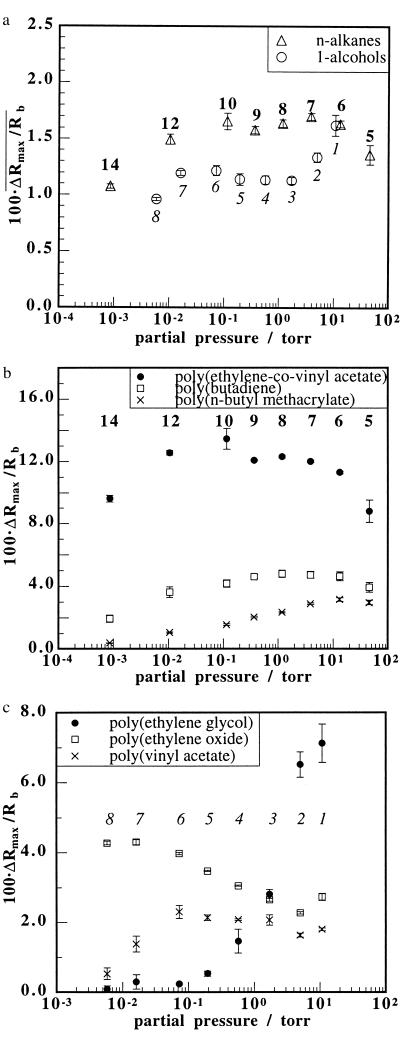
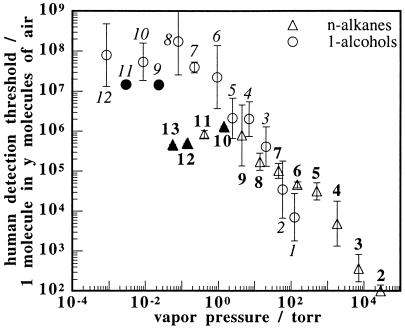
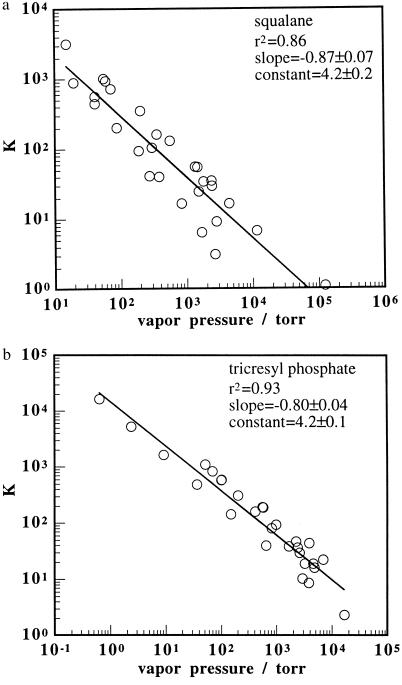
Response data were collected for a carbon black-polymer composite electronic nose array during exposure to homologous series of alkanes and alcohols. The mean response intensity of the electronic nose detectors and the response intensity of the most strongly driven set of electronic nose detectors were essentially constant for members of a chemically homologous odorant series when the concentration of each odorant in the gas phase was maintained at a constant fraction of the odorant's vapor pressure. A similar trend is observed in human odor detection threshold values for these same homologous series of odorants. Because the thermodynamic activity of an odorant at equilibrium in a sorbent phase is equal to the partial pressure of the odorant in the gas phase divided by the vapor pressure of the odorant and because the activity coefficients are similar within these homologous series of odorants for sorption of the vapors into specific polymer films, the data imply that the trends in detector response can be understood based on the thermodynamic tendency to establish a relatively constant concentration of sorbed odorant into each of the polymeric films of the electronic nose at a constant fraction of the odorant's vapor pressure. Similarly, the data are consistent with the hypothesis that the odor detection thresholds observed in human psychophysical experiments for the odorants studied herein are driven predominantly by the similarity in odorant concentrations sorbed into the olfactory epithelium at a constant fraction of the odorant's vapor pressure.


Figures

Figure 1
Figure 1
Histograms showing the response patterns of a 13-detector array of carbon black-polymer detectors exposed in air to methanol at 11 torr, 1-butanol at 0.57 torr, and 1-octanol at 5.8 × 10⁻³ torr (a) and n-pentane at 46 torr, n-nonane at 0.37 torr, and n-tetradecane at 8.5 × 10⁻⁴ torr (b). The odorant partial pressures correspond to 10% of their vapor pressures in ambient air. Each histogram bar represents the average of more than six exposures of a single detector to a single odorant for 5 min. The error bars represent one SD in each sensor’s responses. The polymers in detectors 1–13 were poly(4-vinyl phenol), poly(α-methyl styrene), poly(vinyl acetate), poly(sulfone), poly(caprolactone), poly(ethylene-co-vinyl acetate) (82% ethylene), poly(ethylene oxide), poly(ethylene), poly(butadiene), poly(vinylidene fluoride), poly(n-butyl methacrylate), poly(epichlorohydrin), and poly(ethylene glycol).
Figure 2
Figure 2
(a) Mean signal intensity, defined as the average over all 13 detector responses in the electronic nose array to an odorant, plotted vs. the partial pressures of homologous series of alkane and alcohol odorants. (b) Responses, ΔRmax/Rb, of three individual electronic nose detectors [poly(ethylene-co-vinyl acetate), poly(butadiene), and poly(n-butyl methacrylate)] that produced the largest responses to a homologous series of straight chain alkanes, plotted vs. the partial pressures of the odorants in each series. (c) Responses of three individual detectors [poly(ethylene glycol), poly(ethylene oxide), and poly(vinyl acetate)] that produced the largest responses to a straight chain homologous series of 1-alcohols, plotted vs. the partial pressures of the odorants in each series. The alkanes used in a and b were n-pentane, n-hexane, n-heptane, n-octane, n-nonane, n-decane, n-dodecane, and n-tetradecane. The straight chain alcohols used in a and c were methanol, ethanol, 1-propanol, 1-butanol, 1-pentanol, 1-hexanol, 1-heptanol, and 1-octanol. Each odorant was maintained at a partial pressure equivalent to 10% of its vapor pressure, and the background was ambient air. For clarity, the number of carbons in each odorant is indicated for each data point, in italic type for the alcohols and in nonitalic type for the alkanes. The error bars represent one SD unit in the responses to six exposures of each odorant.
Figure 3
Figure 3
Plot of human olfactory detection thresholds versus the vapor pressure (at 25°C) of a homologous series of straight chain alkanes, ranging from ethane to tridecane, and of 1-alcohols ranging from methanol to dodecanol. For clarity, number of carbons in each odorant is indicated next to the corresponding data point, in italic type for the alcohols and nonitalic type for the alkanes. An average human can detect one odorant molecule in the number of air molecules plotted on the ordinate. The error bars represent one SD unit in the standardized results reported by at least two, and up to 20, authors (1). A solid data point is used if only one author reported results. A best straight line fit through the alcohols from methanol to octanol gives a slope of −1.3 ± 0.1 and an r2 value of 0.96. Similarly, a best straight line fit through the alkanes from ethane through decane gives a slope of −0.94 ± 0.08 and an r2 value of 0.96.
Figure 4
Figure 4
Plots of the partition coefficients, K, for odorants sorbing into the stationary phases with squalane at 100°C (a) and tricresyl phosphate at 120°C (b), obtained from gas chromatography data (19), vs. odorant vapor pressure. The odorants plotted in both plots are methanol, ethanol, acetone, dichloromethane, 1-propanol, ethyl acetate, 2,3-dimethylbutane, n-hexane, chloroform, 1-butanol, 2-chloroethanol, tetrachloromethane, benzene, 1-pentanol, cyclopentanone, toluene, n-octane, 1-hexanol, 1-heptanol, 2-octanol, n-decane, n-butane, 1-octanol, and n-dodecane. Additional odorants plotted only in a are ethane, m-diethylbenzene, o-diethylbenzene, and o-xylene. Additional odorants plotted only in b are ethylene glycol diacetate, n-hexadecane, n-tetradecane, and n-octadecane. The solid lines represent the best line fits through the data points, with the fitting parameters given in the figures.
Figure 5
Figure 5
Plots of the partition coefficient, K, vs. the vapor pressure of homologous series of 1-alcohols (a) and n-alkanes (b) on the squalane stationary phase at 100°C and the tricresyl phosphate stationary phase at 120°C. The series of alcohols plotted in a ranged from methanol to 1-octanol inclusively. The series of alkanes plotted in b consisted of even carbon n-alkanes ranging from ethane to n-dodecane inclusively on the squalane stationary phase and n-butane to n-octadecane inclusively on the tricresyl phosphate stationary phase. The lines indicate the best linear fits and the fitting parameters are given in the figures.

References

    1. Devos M, Patte F, Rouault J, Laffort P, Van Gemert L J. Standardized Human Olfactory Thresholds. New York: Oxford Univ. Press; 1990.
    1. Ohloff G. Scent and Fragrances, the Fashion of Odors and Their Chemical Perspectives. New York: Springer; 1994.
    1. Amoore J E. Molecular Basis of Odour. Springfield, IL: Thomas; 1970.
    1. Dravnieks A. Flavor Quality: Objective Measurement. Washington, DC: Am. Chem. Soc.; 1977. pp. 11–28.
    1. Edwards P A, Jurs P C. Chem Senses. 1989;14:281–291.

Publication types

LinkOut - more resources