

Application of a time-dependent coalescence process for inferring the history of population size changes from DNA sequence data
- PMID: 9576903
- PMCID: PMC20398
- DOI: 10.1073/pnas.95.10.5456
Application of a time-dependent coalescence process for inferring the history of population size changes from DNA sequence data
Abstract
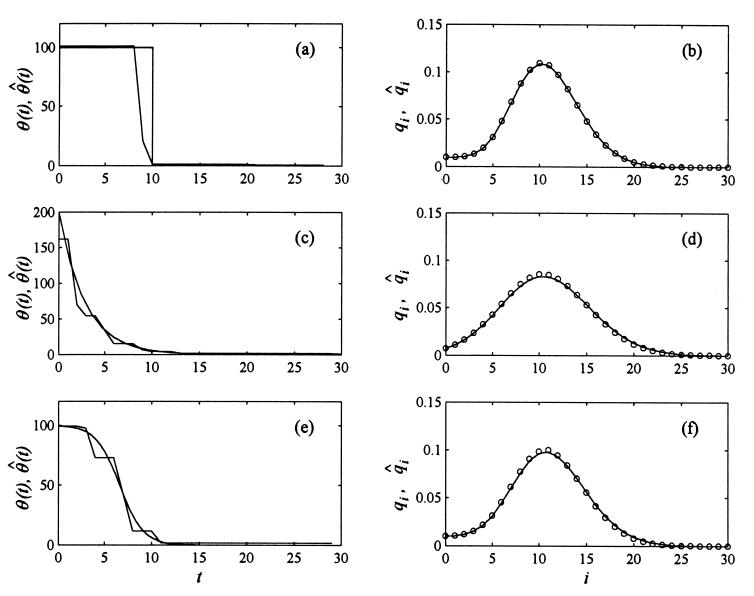
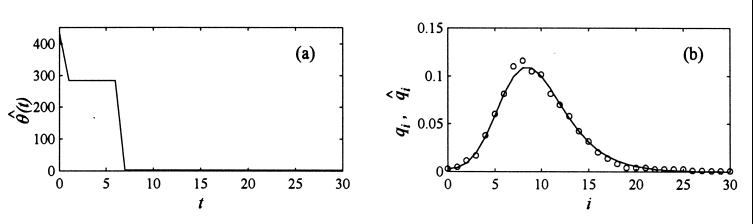
Distribution of pairwise differences of nucleotides from data on a sample of DNA sequences from a given segment of the genome has been used in the past to draw inferences about the past history of population size changes. However, all earlier methods assume a given model of population size changes (such as sudden expansion), parameters of which (e.g., time and amplitude of expansion) are fitted to the observed distributions of nucleotide differences among pairwise comparisons of all DNA sequences in the sample. Our theory indicates that for any time-dependent population size, N(tau) (in which time tau is counted backward from present), a time-dependent coalescence process yields the distribution, p(tau), of the time of coalescence between two DNA sequences randomly drawn from the population. Prediction of p(tau) and N(tau) requires the use of a reverse Laplace transform known to be unstable. Nevertheless, simulated data obtained from three models of monotone population change (stepwise, exponential, and logistic) indicate that the pattern of a past population size change leaves its signature on the pattern of DNA polymorphism. Application of the theory to the published mtDNA sequences indicates that the current mtDNA sequence variation is not inconsistent with a logistic growth of the human population.
Figures
References
Publication types
MeSH terms
Substances
Grants and funding
LinkOut - more resources
Full Text Sources
Miscellaneous
