. 1998 May 12;95(10):5474-9.
doi: 10.1073/pnas.95.10.5474.

The basic-helix-loop-helix-PAS orphan MOP3 forms transcriptionally active complexes with circadian and hypoxia factors

Affiliations

The basic-helix-loop-helix-PAS orphan MOP3 forms transcriptionally active complexes with circadian and hypoxia factors

J B Hogenesch et al. Proc Natl Acad Sci U S A. .

Abstract

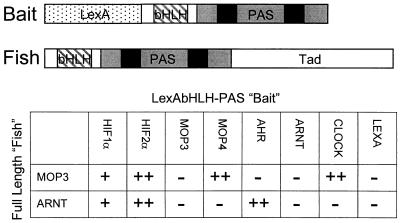
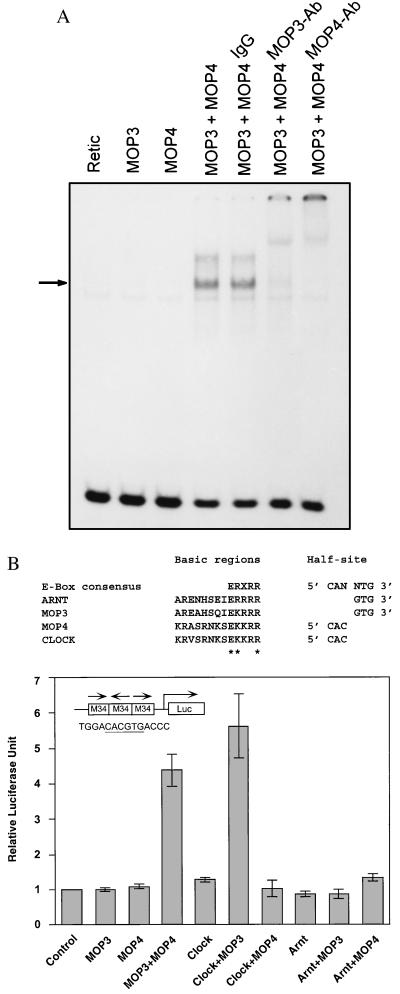
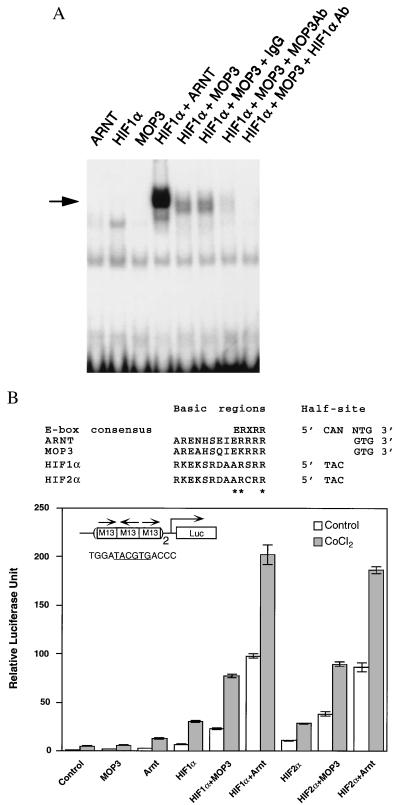
We report that MOP3 is a general dimerization partner for a subset of the basic-helix-loop-helix (bHLH)-PER-ARNT-SIM (PAS) superfamily of transcriptional regulators. We demonstrated that MOP3 interacts with MOP4, CLOCK, hypoxia-inducible factor 1alpha (HIF1alpha), and HIF2alpha. A DNA selection protocol revealed that the MOP3-MOP4 heterodimer bound a CACGTGA-containing DNA element. Transient transfection experiments demonstrated that the MOP3-MOP4 and MOP3-CLOCK complexes bound this element in COS-1 cells and drove transcription from a linked luciferase reporter gene. We also deduced the high-affinity DNA binding sites for MOP3-HIF1alpha complex (TACGTGA) and used transient transfection experiments to demonstrate that the MOP3-HIF1alpha and MOP3-HIF2alpha heterodimers bound this element, drove transcription, and responded to cellular hypoxia. Finally, we found that MOP3 mRNA expression overlaps in a number of tissues with each of its four potential partner molecules in vivo.


Figures

Figure 1
Figure 1
Interaction panel of LexAbHLH-PAS fusion proteins with full-length MOP3 and ARNT. (Upper) Schematic representation of the LexAbHLHPAS “bait” and the full-length “fish.” The bHLH and PAS domains are boxed. The “A” and “B” repeats of the PAS domains are indicated. The transactivation domain of the full-length “fish” is indicated. (Lower) LexA fusion protein plasmids containing the bHLH-PAS domains of HIF1α, HIF2α, MOP3, MOP4, AHR, ARNT, and CLOCK were coexpressed with plasmids harboring full-length MOP3 and ARNT (see Materials and Methods). LexAAHR interactions were assayed on plates containing 1 μM β-naphthoflavone (14). After incubation, an 5-bromo-4-chloro-3-indolyl β-d-galactoside overlay assay was performed. ++, A strong interaction, turning blue within 2 hr; +, a weaker interaction, turning blue between 8 hr and overnight; and −, a negative interaction after overnight incubation. The experiment was performed three times with identical results.
Figure 2
Figure 2
DNA binding specificity of the MOP3-MOP4 heterodimer. (A) The consensus DNA binding site for MOP3-MOP4 heterodimer in vitro. Ten selected DNA sequences bound by the MOP3-MOP4 complex are indicated with the E-box core boxed. Underneath, the M34 consensus is indicated. Nucleotide positions relative to the E-box core are shown. Bases in uppercase are randomer derived, while bases in lower case are primer derived. (B) Demonstration of flanking region specificity by competition analysis. A gel shift analysis was performed in which the double-stranded radiolabeled consensus oligonucleotide, GGGACACGTGACCC, was incubated in the presence of MOP3, MOP4, and either 10, 30, or 100 ng of double-stranded unlabeled competitor oligonucleotides. The unlabeled competitors were designed identical to the labeled oligonucleotide except the most conserved +4 “A” was changed to A, C, G, or T.
Figure 3
Figure 3
Interaction of MOP3 with MOP4 or CLOCK. (A) In vitro interaction of MOP3 and MOP4. Gel shift analysis was performed using the radiolabeled consensus response element, M34, in the presence of unprogrammed reticulocyte lysate, MOP3, MOP4, and both proteins. One microgram of purified IgG, purified MOP3-specific antibodies (MOP3Ab), or purified MOP4-specific antibodies (MOP4Ab) was used to demonstrate specificity of the complex. (B) In vivo interaction of MOP3 with MOP4 or CLOCK. (Upper) Basic region consensus and DNA half-site specificity for ARNT, MOP3, MOP4, and CLOCK are shown. Residues thought to contact DNA are denoted with an asterisk. (Lower) COS-1 cells were transfected with the M34 luciferase reporter with each expression plasmid as indicated. Cells were harvested 20 hr posttransfection. Luciferase activities were normalized with that of β-galactosidase as described (14). (Inset) The M34 responsive element is illustrated and the core sequence is underlined.
Figure 4
Figure 4
Interaction of MOP3 with HIF1α or HIF2α. (A) In vitro analysis of MOP3 and HIF1α. Gel shift analysis was performed using a deduced radiolabeled response element, M13. Normalized quantities of reticulocyte expressed MOP3, HIF1α, and ARNT proteins were used for all gel shift studies. To demonstrate specificity, 1 μg of purified IgG, MOP3-specific (MOP3Ab), or HIF1α-specific antibodies (HIF1αAb) were used. (B) In vivo interaction of MOP3 with HIF1α or HIF2α (Upper) Basic region consensus and DNA half-site specificity for ARNT, MOP3, HIF1α, and HIF2α are shown. (Lower) COS-1 cells were transfected with the M13 luciferase reporter with each expression plasmid as indicated. Two oligonucleotides, containing three M13 elements were cloned upstream of the simian virus 40 promoter (denoted by a 2 beside the element). Hypoxia studies were performed with the addition of 100 μM CoCl2 at the time of transfection. Cells were harvested 20 hr posttransfection. □, Relative luciferase levels; ▪, relative luciferase levels in the presence of CoCl2. (Inset) The M13 responsive element is illustrated and the core sequence is underlined.
Figure 5
Figure 5
Expression of MOP3 and MOP4 in the mouse. (A) RPA analysis of MOP3 and MOP4 in various mouse tissues. Total RNA (10 μg) from whole embryo (embryonic day 9.5 (E9.5), E13.5, E17.5), placenta, neonatal liver, kidney, heart, lung, thymus, skeletal muscle, brain, and adult liver, kidney, heart, lung, thymus, skeletal muscle, and brain was analyzed for MOP3 and MOP4 expression. The results were quantitated and expressed as relative units. (Inset) The MOP3 and MOP4 probes (lane 1), tRNA control (lane 2), and protected fragments (lane 3) are indicated. (B) In situ analysis of the MOP3 mRNA. Whole mount in situ hybridization was performed on transverse brain section from an E15.5 embryo, adult eye, thymus, and colon. Slides were probed with antisense probes derived from HIF1α, MOP3, and MOP4 and photographed under identical conditions. Hematoxylin and eosin stains of parallel slides of E15.5 transverse embryos and adult eye are shown. Transverse section: ca, cerebral aqueduct; T, thalamus; lv, lateral ventricle; 3v, third ventricle; st, striatum. Eye: pr, pigment of the retina; or, outer layer of the retina; ir, inner layer of the retina; le, lens epithelium; co, cornea.

Similar articles

Cited by

References

    1. Huang Z J, Edery I, Rosbash M. Nature (London) 1993;364:259–262. - PubMed
    1. Burbach K M, Poland A, Bradfield C A. Proc Natl Acad Sci USA. 1992;89:8185–8189. - PMC - PubMed
    1. Hoffman E C, Reyes H, Chu F F, Sander F, Conley L H, Brooks B A, Hankinson O. Science. 1991;252:954–958. - PubMed
    1. Nambu J R, Lewis J O, Wharton K A, Jr, Crews S T. Cell. 1991;67:1157–1167. - PubMed
    1. Jackson F R, Bargiello T A, Yun S H, Young M W. Nature (London) 1986;320:185–188. - PubMed

Publication types

Associated data