. 1998 May 12;95(10):5700-5.
doi: 10.1073/pnas.95.10.5700.

The mosquito Anopheles stephensi limits malaria parasite development with inducible synthesis of nitric oxide

Affiliations

The mosquito Anopheles stephensi limits malaria parasite development with inducible synthesis of nitric oxide

S Luckhart et al. Proc Natl Acad Sci U S A. .

Abstract

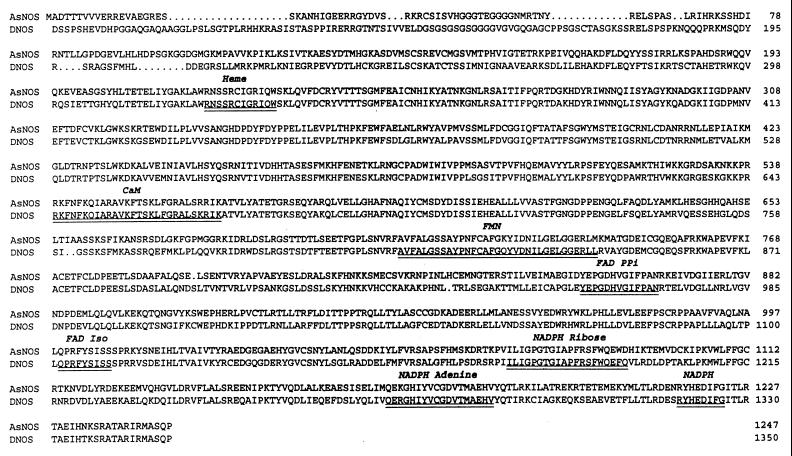
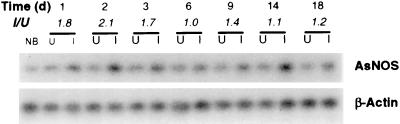
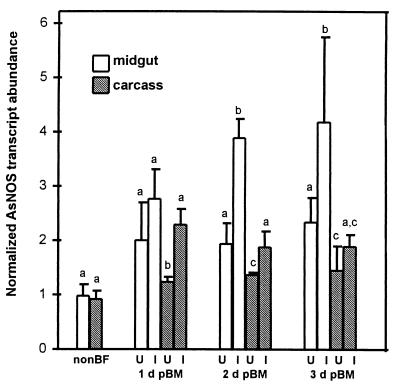
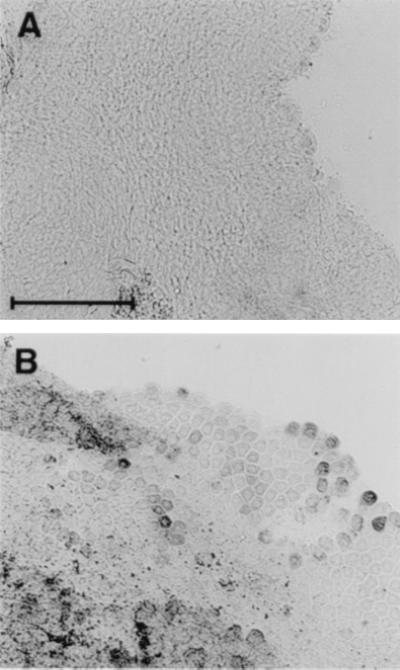
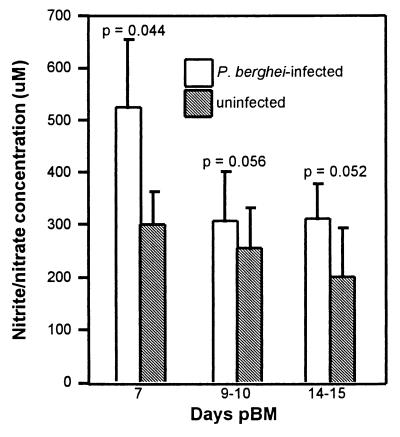
We have discovered that the mosquito Anopheles stephensi, a natural vector of human malaria, limits parasite development with inducible synthesis of nitric oxide (NO). Elevated expression of A. stephensi NO synthase (NOS), which is highly homologous to characterized NOS genes, was detected in the midgut and carcass soon after invasion of the midgut by Plasmodium. Early induction is likely primed by bacterial growth in the blood meal. Later increases in A. stephensi NOS expression and enzyme activity occurred at the beginning of sporozoite release. Circulating levels of nitrite/nitrate, end-products of NO synthesis, were significantly higher in Plasmodium-infected mosquitoes. Dietary provision of the NOS substrate L-arginine reduced Plasmodium infections in A. stephensi. In contrast, dietary provision of a NOS inhibitor significantly increased parasite numbers in infected mosquitoes, confirming that A. stephensi limits Plasmodium development with NO.


Figures

Figure 1
Figure 1
Comparison of AsNOS (GenBank accession no. AF053344) and DNOS (9) deduced amino acid sequences. The first AsNOS amino acid is the putative initiation methionine; alignment with DNOS begins at D81. Presumed cofactor-binding domains for heme, calmodulin (CaM), FMN, FAD pyrophosphate (FAD PPi), FAD isoalloxazine (FAD Iso), NADPH ribose, NADPH adenine, and NADPH are double-underlined (9). Abbreviations for the amino acid residues are as follows: A, Ala; C, Cys; D, Asp; E, Glu; F, Phe; G, Gly; H, His; I, Ile; K, Lys; L, Leu; M, Met; N, Asn; P, Pro; Q, Gln; R, Arg; S, Ser; T, Thr; V, Val; W, Trp; and Y, Tyr.
Figure 2
Figure 2
AsNOS expression in uninfected and Plasmodium-infected A. stephensi. Total RNA from non-blood fed (NB), blood fed uninfected (U), and P. berghei-infected (I) A. stephensi was assayed by using semi-quantitative RT-PCR for AsNOS at 1–18 days pBM. AsNOS transcript abundance, reflected by hybridization signal intensity, was normalized for each time point against β-actin to correct for sample-to-sample differences in PCR template. The ratio of normalized infected/uninfected (I/U) indicates the fold-induction of AsNOS expression in infected mosquitoes.
Figure 3
Figure 3
AsNOS expression in uninfected and Plasmodium-infected A. stephensi. Total RNA from midguts and carcasses of non-blood fed (nonBF), blood fed uninfected (U), and P. berghei-infected (I) A. stephensi was assayed by using semi-quantitative RT-PCR for AsNOS at 1, 2, and 3 days post-blood meal (d pBM). Transcript abundance was normalized against a ribosomal S7 protein gene (13, 14) to correct for sample-to-sample differences in PCR template. Data from three treatment replicates at each time point were analyzed by paired t test (α = 0.075); significant differences within groups are indicated by different letters.
Figure 4
Figure 4
Representative diaphorase staining of midguts from blood fed uninfected and Plasmodium-infected A. stephensi. (A) Uninfected 24 hr pBM. (Bar = 300 μm.) (B) P. berghei-infected 24 hr pBM (same magnification as A).
Figure 5
Figure 5
Hemolymph nitrite/nitrate of blood fed uninfected and P. berghei-infected A. stephensi was determined at 7, 9–10, and 14–15 days pBM by using a cadmium reduction/Griess reagent microassay (24). Means were analyzed by using a paired t test (α = 0.075); P values are reported above the bars.

References

    1. Dimopoulos G, Richman A, della Torre A, Kafatos F C, Louis C. Proc Natl Acad Sci USA. 1996;93:13066–13071. - PMC - PubMed
    1. Richman A M, Dimopoulos G, Seeley D, Kafatos F C. EMBO J. 1997;16:6114–6119. - PMC - PubMed
    1. Dimopoulos G, Richman A M, Muller H-M, Kafatos F C. Proc Natl Acad Sci USA. 1997;94:11508–11513. - PMC - PubMed
    1. Stuehr D J. In: Methods in Enzymology. Packer L, editor. 268A. San Diego: Academic; 1996. pp. 324–333. - PubMed
    1. Nathan C F, Hibbs J B., Jr Curr Opin Immunol. 1991;3:65–70. - PubMed

Publication types

LinkOut - more resources