Defense activation and enhanced pathogen tolerance induced by H2O2 in transgenic tobacco
- PMID: 9576968
- PMCID: PMC20463
- DOI: 10.1073/pnas.95.10.5818
Defense activation and enhanced pathogen tolerance induced by H2O2 in transgenic tobacco
Abstract
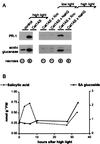
Transgenic tobacco deficient in the H2O2-removing enzyme catalase (Cat1AS) was used as an inducible and noninvasive system to study the role of H2O2 as an activator of pathogenesis-related (PR) proteins in plants. Excess H2O2 in Cat1AS plants was generated by simply increasing light intensities. Sustained exposure of Cat1AS plants to excess H2O2 provoked tissue damage, stimulated salicylic acid and ethylene production, and induced the expression of acidic and basic PR proteins with a timing and magnitude similar to the hypersensitive response against pathogens. Salicylic acid production was biphasic, and the first peak of salicylic acid as well as the peak of ethylene occurred within the first hours of high light, which is long before the development of tissue necrosis. Under these conditions, accumulation of acidic PR proteins was also seen in upper leaves that were not exposed to high light, indicating systemic induction of expression. Short exposure of Cat1AS plants to excess H2O2 did not cause damage, induced local expression of acidic and basic PR proteins, and enhanced pathogen tolerance. However, the timing and magnitude of PR protein induction was in this case more similar to that in upper uninfected leaves than to that in hypersensitive-response leaves of pathogen-infected plants. Together, these data demonstrate that sublethal levels of H2O2 activate expression of acidic and basic PR proteins and lead to enhanced pathogen tolerance. However, rapid and strong activation of PR protein expression, as seen during the hypersensitive response, occurs only when excess H2O2 is accompanied by leaf necrosis.
Figures


Similar articles
-
Hydrogen peroxide does not function downstream of salicylic acid in the induction of PR protein expression.Plant J. 1995 Aug;8(2):235-45. doi: 10.1046/j.1365-313x.1995.08020235.x. Plant J. 1995. PMID: 7670505
-
Development of necrosis and activation of disease resistance in transgenic tobacco plants with severely reduced catalase levels.Plant J. 1997 May;11(5):993-1005. doi: 10.1046/j.1365-313x.1997.11050993.x. Plant J. 1997. PMID: 9193071
-
Transgenic tobacco plants expressing the maize Cat2 gene have altered catalase levels that affect plant-pathogen interactions and resistance to oxidative stress.Transgenic Res. 2001 Dec;10(6):555-69. doi: 10.1023/a:1013027920444. Transgenic Res. 2001. PMID: 11817543
-
Plant 'pathogenesis-related' proteins and their role in defense against pathogens.Biochimie. 1993;75(8):687-706. doi: 10.1016/0300-9084(93)90100-7. Biochimie. 1993. PMID: 8286442 Review.
-
Catalase-deficient tobacco plants: tools for in planta studies on the role of hydrogen peroxide.Redox Rep. 2001;6(1):37-42. doi: 10.1179/135100001101536012. Redox Rep. 2001. PMID: 11333114 Review.
Cited by
-
Glutathione.Arabidopsis Book. 2011;9:e0142. doi: 10.1199/tab.0142. Epub 2011 Feb 18. Arabidopsis Book. 2011. PMID: 22303267 Free PMC article.
-
Chemical Genetics Approach Identifies Abnormal Inflorescence Meristem 1 as a Putative Target of a Novel Sulfonamide That Protects Catalase2-Deficient Arabidopsis against Photorespiratory Stress.Cells. 2020 Sep 2;9(9):2026. doi: 10.3390/cells9092026. Cells. 2020. PMID: 32887516 Free PMC article.
-
Transient expression of glyoxal oxidase from the Chinese wild grape Vitis pseudoreticulata can suppress powdery mildew in a susceptible genotype.Protoplasma. 2011 Apr;248(2):415-23. doi: 10.1007/s00709-010-0162-4. Epub 2010 May 29. Protoplasma. 2011. PMID: 20512385
-
Glufosinate ammonium-induced pathogen inhibition and defense responses culminate in disease protection in bar-transgenic rice.Plant Physiol. 2008 Jan;146(1):213-27. doi: 10.1104/pp.107.105890. Epub 2007 Nov 2. Plant Physiol. 2008. PMID: 17981989 Free PMC article.
-
AlgT (sigma22) controls alginate production and tolerance to environmental stress in Pseudomonas syringae.J Bacteriol. 1999 Dec;181(23):7176-84. doi: 10.1128/JB.181.23.7176-7184.1999. J Bacteriol. 1999. PMID: 10572118 Free PMC article.
References
-
- Sticher L, Mauch-Mani B, Métraux J P. Ann Rev Phytopathol. 1997;35:235–270. - PubMed
-
- Hunt M D, Ryals J A. Crit Rev Plant Sci. 1996;15:583–606.
-
- Heitz T, Fritig B, Legrand M. Mol Plant–Microbe Interact. 1994;7:776–779.
Publication types
MeSH terms
Substances
LinkOut - more resources
Full Text Sources
Other Literature Sources
Research Materials

