. 1998 May 18;187(10):1671-9.
doi: 10.1084/jem.187.10.1671.

Roles of the tumor suppressor p53 and the cyclin-dependent kinase inhibitor p21WAF1/CIP1 in receptor-mediated apoptosis of WEHI 231 B lymphoma cells

Affiliations

Roles of the tumor suppressor p53 and the cyclin-dependent kinase inhibitor p21WAF1/CIP1 in receptor-mediated apoptosis of WEHI 231 B lymphoma cells

M Wu et al. J Exp Med. .

Abstract

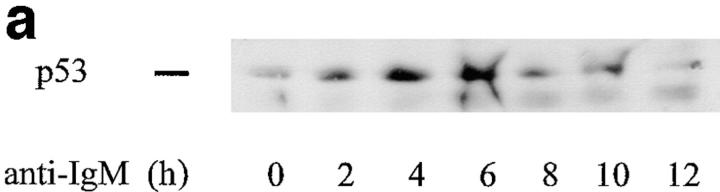
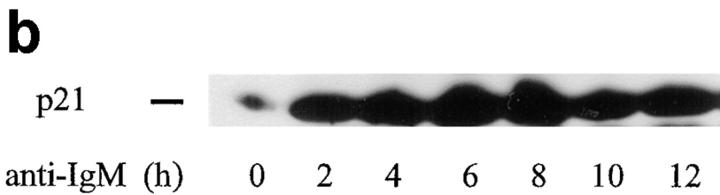
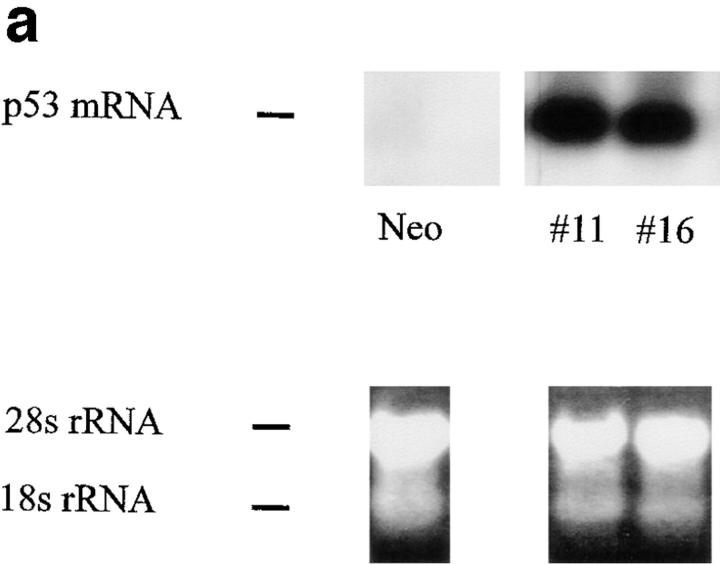
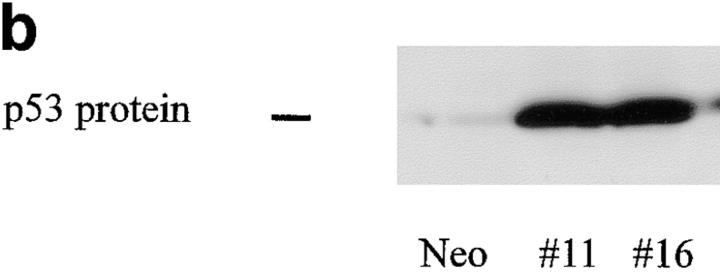
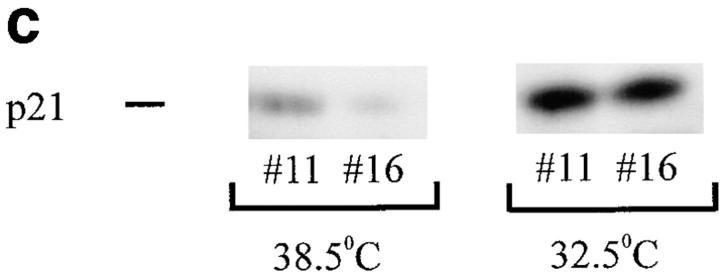
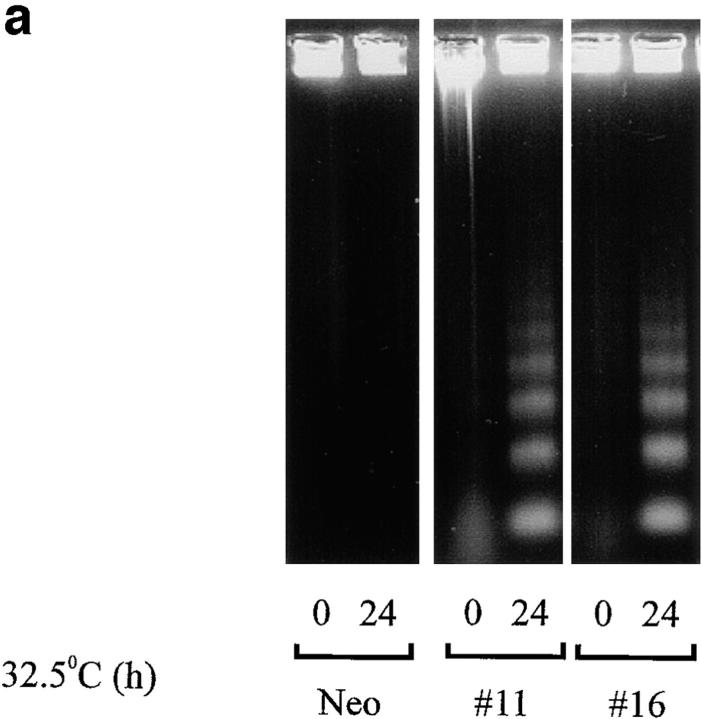
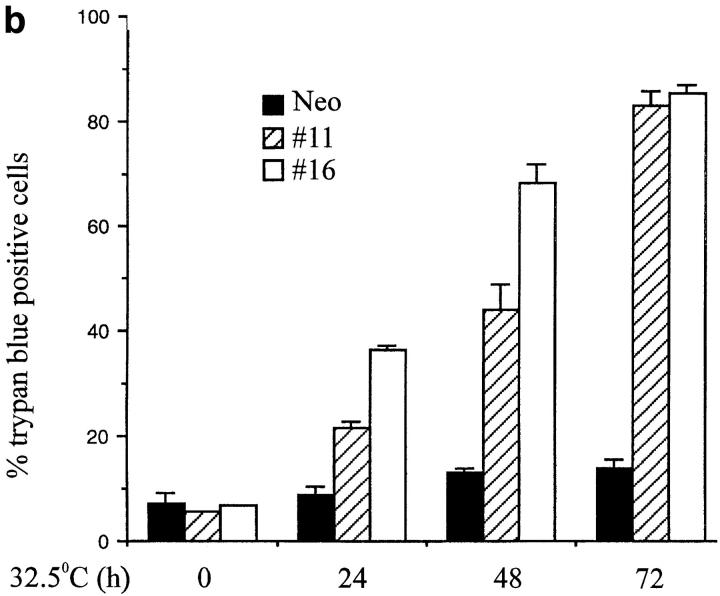
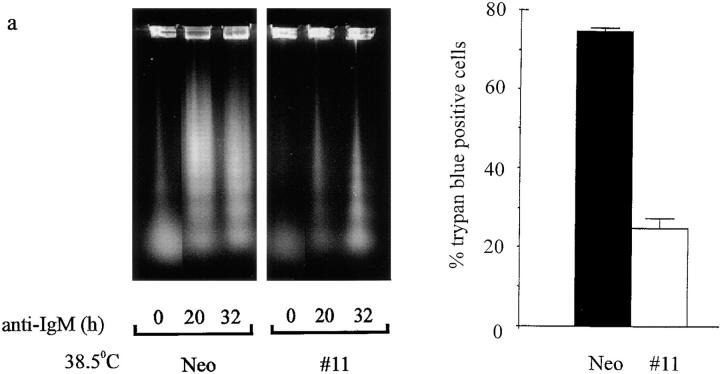
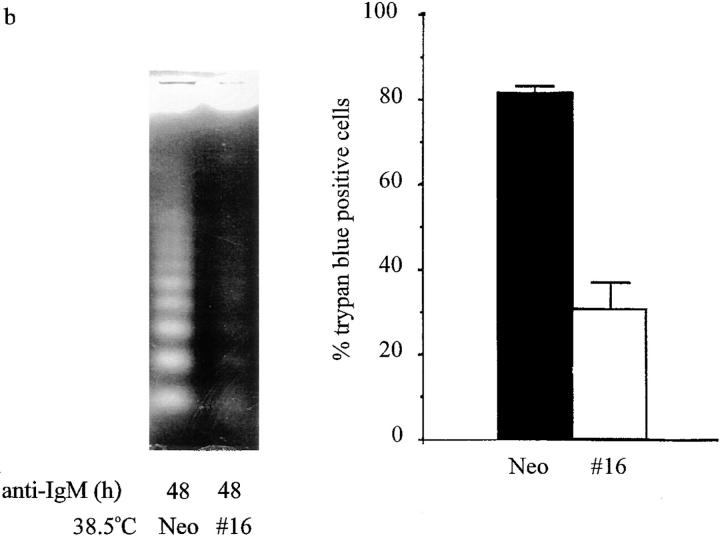
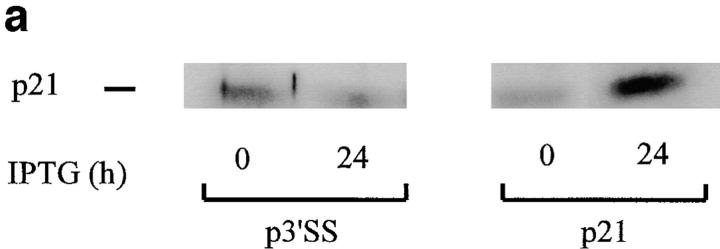
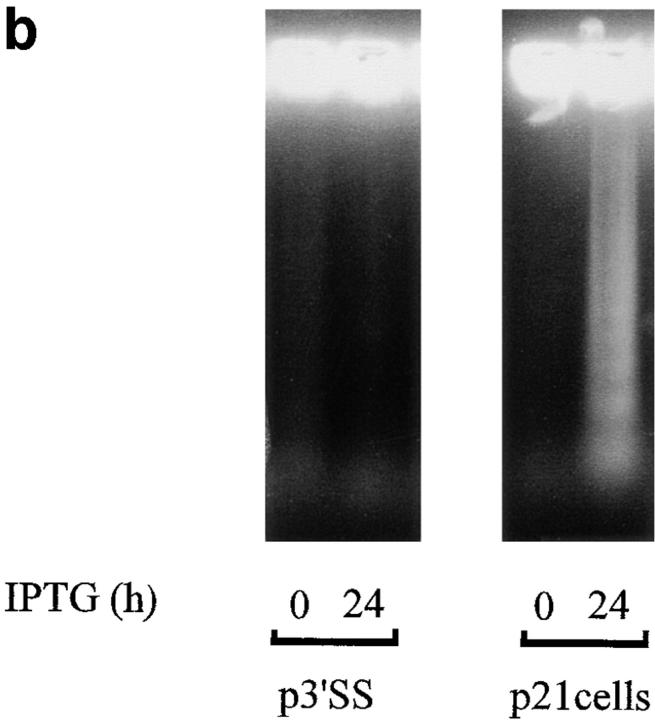
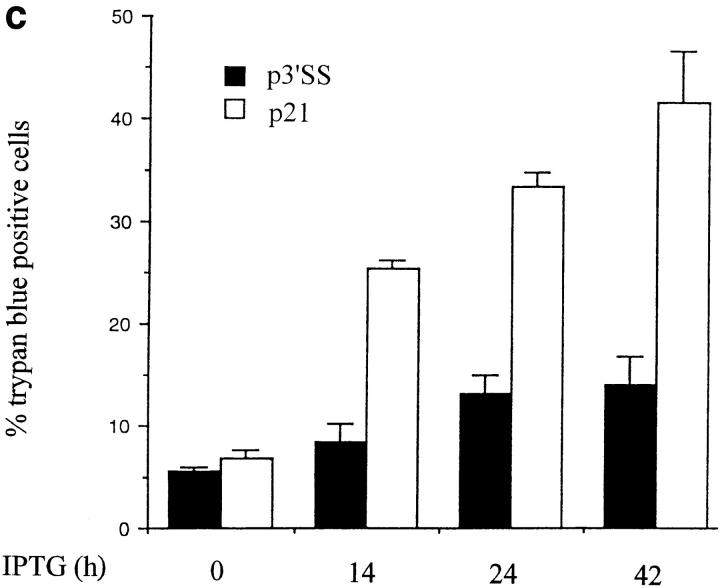
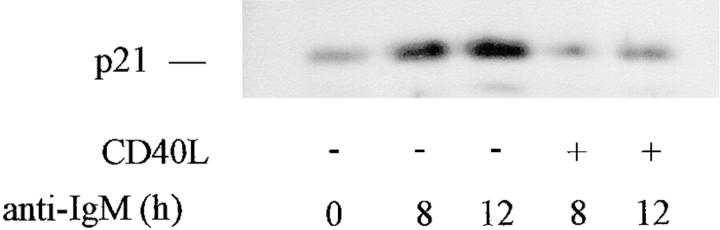
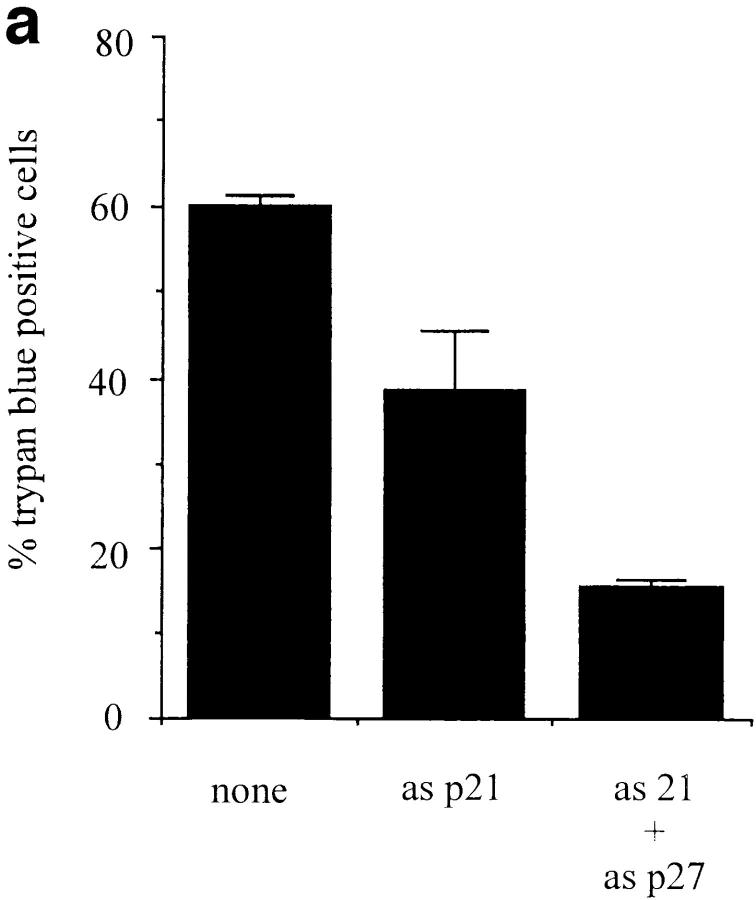
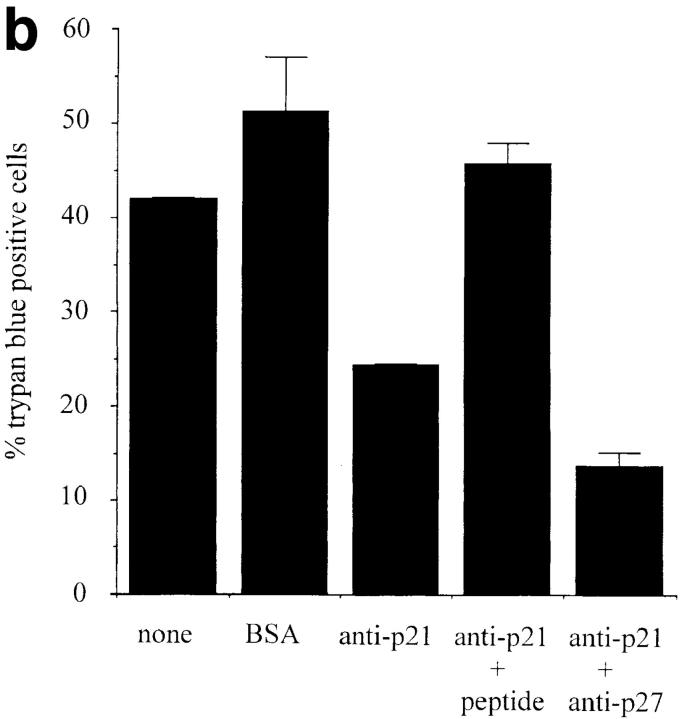
Treatment of WEHI 231 immature B lymphoma cells with an antibody against their surface immunoglobulin M (anti-IgM) induces apoptosis and has been studied extensively as a model of self-induced B cell tolerance. Since the tumor suppressor protein p53 has been implicated in apoptosis in a large number of cell types and has been found to be mutated in a variety of B cell tumors, here we sought to determine whether p53 and the p53 target gene cyclin-dependent kinase inhibitor p21(WAF1/CIP1) were involved in anti-IgM-induced cell death. Anti-IgM treatment of WEHI 231 cells increased expression of p53 and p21 protein levels. Ectopic expression of wild-type p53 in WEHI 231 cells induced both p21 expression and apoptosis. Ectopic expression of p21 similarly induced apoptosis. Rescue of WEHI 231 cells from apoptosis by costimulation with CD40 ligand ablated the increase in p21 expression. Lastly, a significant decrease in anti-IgM-mediated apoptosis was seen upon downregulation of endogenous p53 activity by expression of a dominant-negative p53 protein or upon microinjection of an antisense p21 expression vector or antibody. Taken together, the above data demonstrate important roles for p53 and p21 proteins in receptor-mediated apoptosis of WEHI 231 B cells.


Figures

Figure 1
Figure 1
Anti-IgM treatment induces p53 and p21 proteins. (a) p53 analysis. Nuclear proteins were isolated from exponentially growing WEHI 231 cells treated with anti-IgM for 0, 2, 4, 6, 8, 10, or 12 h, and samples (20 μg) were subjected to immunoblotting for p53 expression with a mouse monoclonal antibody. Detection was achieved using a horseradish peroxidase–conjugated secondary antibody and chemiluminescence as previously described (10). (b) p21 analysis. Total cellular proteins were prepared from WEHI 231 cells treated with anti-IgM for 0, 2, 4, 6, 8, 10, or 12 h, and samples (50 μg) were subjected to immunoblotting for expression of the CDK inhibitor p21 using an affinity-purified rabbit antibody (sc-397; Santa Cruz Biotechnology).
Figure 1
Figure 1
Anti-IgM treatment induces p53 and p21 proteins. (a) p53 analysis. Nuclear proteins were isolated from exponentially growing WEHI 231 cells treated with anti-IgM for 0, 2, 4, 6, 8, 10, or 12 h, and samples (20 μg) were subjected to immunoblotting for p53 expression with a mouse monoclonal antibody. Detection was achieved using a horseradish peroxidase–conjugated secondary antibody and chemiluminescence as previously described (10). (b) p21 analysis. Total cellular proteins were prepared from WEHI 231 cells treated with anti-IgM for 0, 2, 4, 6, 8, 10, or 12 h, and samples (50 μg) were subjected to immunoblotting for expression of the CDK inhibitor p21 using an affinity-purified rabbit antibody (sc-397; Santa Cruz Biotechnology).
Figure 2
Figure 2
Expression of p53 and p21 in the temperature-sensitive p53 cell lines. WEHI 231 cell lines were electroporated with 40 μg DNA of pLTRp53cGVal135 ts p53 expression vector (35) plus 2 μg of pSV2Neo vector as a selective marker, and p53#11, p53#13, and p53#16 stable lines obtained by limiting dilution. Similarly, WEHI 231 cells were transfected with 2 μg of pSV2Neo alone to establish a population of control cells (Neo). Cell lines were maintained at 38.5°C where p53 is in a dominant negative mutant form. (a) p53 RNA analysis. Cytoplasmic RNA was isolated from clones p53#11 and p53#16 lines and pSV2Neo cells, and samples (20 μg) subjected to Northern blotting using the murine p53 DNA pLTRp53cGVal135 as probe (35). Bottom panel shows ethidium bromide staining of the 28S and 18S rRNA on the Northern blot, which indicates equal loading and RNA integrity. (b) p53 protein analysis. Total cellular proteins were extracted with RIPA buffer from p53#11, p53#16 and control Neo cells, and samples (50 μg) subjected to immunoblotting using the p53 antibody Pab421. (c) p21 protein analysis. Cultures of p53#11 and p53#16 cell lines were kept at 38.5°C or switched to 32.5°C, and total cellular proteins isolated after 24 h. Samples (50 μg) were analyzed for p21 protein by immunoblotting using an affinity purified rabbit antibody against p21 protein (sc-397, Santa Cruz Biotechnology).
Figure 2
Figure 2
Expression of p53 and p21 in the temperature-sensitive p53 cell lines. WEHI 231 cell lines were electroporated with 40 μg DNA of pLTRp53cGVal135 ts p53 expression vector (35) plus 2 μg of pSV2Neo vector as a selective marker, and p53#11, p53#13, and p53#16 stable lines obtained by limiting dilution. Similarly, WEHI 231 cells were transfected with 2 μg of pSV2Neo alone to establish a population of control cells (Neo). Cell lines were maintained at 38.5°C where p53 is in a dominant negative mutant form. (a) p53 RNA analysis. Cytoplasmic RNA was isolated from clones p53#11 and p53#16 lines and pSV2Neo cells, and samples (20 μg) subjected to Northern blotting using the murine p53 DNA pLTRp53cGVal135 as probe (35). Bottom panel shows ethidium bromide staining of the 28S and 18S rRNA on the Northern blot, which indicates equal loading and RNA integrity. (b) p53 protein analysis. Total cellular proteins were extracted with RIPA buffer from p53#11, p53#16 and control Neo cells, and samples (50 μg) subjected to immunoblotting using the p53 antibody Pab421. (c) p21 protein analysis. Cultures of p53#11 and p53#16 cell lines were kept at 38.5°C or switched to 32.5°C, and total cellular proteins isolated after 24 h. Samples (50 μg) were analyzed for p21 protein by immunoblotting using an affinity purified rabbit antibody against p21 protein (sc-397, Santa Cruz Biotechnology).
Figure 3
Figure 3
Induction of apoptosis by ectopic p53 expression. (a) DNA laddering. The p53 expressing clones p53#11, p53#16, and control Neo cells were cultured at 32.5°C for 0 or 24 h, and subjected to DNA ladder assays (34), as a measure of induction of apoptosis. (b) Trypan blue staining. The p53 expressing clones p53#11 (hatched bars), p53#16 (open bars) and control Neo (filled bars) cells were cultured in duplicate at 32.5°C for 0, 24, 48, or 72 h in 96-well dishes, and induction of cell death determined by trypan blue staining. Numbers of cells stained trypan are plotted as a function of time in hours. The statistical significance was obtained using the Student's t test, and the vertical bars represent the standard deviation.
Figure 3
Figure 3
Induction of apoptosis by ectopic p53 expression. (a) DNA laddering. The p53 expressing clones p53#11, p53#16, and control Neo cells were cultured at 32.5°C for 0 or 24 h, and subjected to DNA ladder assays (34), as a measure of induction of apoptosis. (b) Trypan blue staining. The p53 expressing clones p53#11 (hatched bars), p53#16 (open bars) and control Neo (filled bars) cells were cultured in duplicate at 32.5°C for 0, 24, 48, or 72 h in 96-well dishes, and induction of cell death determined by trypan blue staining. Numbers of cells stained trypan are plotted as a function of time in hours. The statistical significance was obtained using the Student's t test, and the vertical bars represent the standard deviation.
Figure 4
Figure 4
Downregulation of endogenous p53 activity inhibits anti-IgM–induced apoptosis. (a) The p53 expressing clone p53#11 and Neo control cells were grown at 38.5°C and treated with anti-IgM for 0, 20, or 32 h, and analyzed for apoptosis by DNA ladder assays (left panel). Alternatively, p53#11 and Neo control cells were cultured in duplicate at 38.5°C and treated with anti-IgM for 48 h, and cell death was analyzed by trypan blue staining (right panel). Data are plotted as the mean percentage of cells stained positive for trypan blue. The statistical significance was obtained using the Student's t test, and the vertical bars represent the standard deviation. (b) The p53-expressing clone p53#16 and Neo control cells were cultured at 38.5°C and treated with anti-IgM for 48 h, and analyzed as above. Alternatively, p53#16 and Neo control cells were cultured in duplicate at 38.5°C and treated with anti-IgM for 0 or 48 h, and analyzed by trypan blue staining for cell death. Data are plotted as above.
Figure 4
Figure 4
Downregulation of endogenous p53 activity inhibits anti-IgM–induced apoptosis. (a) The p53 expressing clone p53#11 and Neo control cells were grown at 38.5°C and treated with anti-IgM for 0, 20, or 32 h, and analyzed for apoptosis by DNA ladder assays (left panel). Alternatively, p53#11 and Neo control cells were cultured in duplicate at 38.5°C and treated with anti-IgM for 48 h, and cell death was analyzed by trypan blue staining (right panel). Data are plotted as the mean percentage of cells stained positive for trypan blue. The statistical significance was obtained using the Student's t test, and the vertical bars represent the standard deviation. (b) The p53-expressing clone p53#16 and Neo control cells were cultured at 38.5°C and treated with anti-IgM for 48 h, and analyzed as above. Alternatively, p53#16 and Neo control cells were cultured in duplicate at 38.5°C and treated with anti-IgM for 0 or 48 h, and analyzed by trypan blue staining for cell death. Data are plotted as above.
Figure 5
Figure 5
Ectopic expression of p21 induces WEHI 231 cell death. WEHI 231 cells were electroporated with 30 μg pOPRSVI-p21 and 10 μg p3′SS vector encoding the Lac I repressor and a mixed population of p21 transfectants were selected using 350 μg/ml hygromycin B and 1,000 μg/ml G418. Alternatively, WEHI 231 cells electroporated with control p3′SS were selected with hygromycin alone. (a) p21 protein analysis. Total proteins were prepared from pOPRSVI-p21 and control p3′SS transfected cells after treatment with 20 mM IPTG for 24 h, and samples (50 μg) were subjected to immunoblot analyses for expression of p21. (b) DNA ladder assay. Cultures of the control pOPRSVI-p21 and p3′SS transfected cells were treated with 20 mM IPTG for 24 h and analyzed for apoptosis by a DNA ladder assay. (c)Trypan blue staining. Cultures of the pOPRSVI-p21 and p3′SS transfected cells were treated in duplicate with 20 mM IPTG for 24 h, and extent of cell death was assessed by trypan blue staining. Data are plotted as the mean percentage of cells stained positive for trypan blue. The statistical significance was obtained using the Student's t test, and the vertical bars represent the standard deviation.
Figure 5
Figure 5
Ectopic expression of p21 induces WEHI 231 cell death. WEHI 231 cells were electroporated with 30 μg pOPRSVI-p21 and 10 μg p3′SS vector encoding the Lac I repressor and a mixed population of p21 transfectants were selected using 350 μg/ml hygromycin B and 1,000 μg/ml G418. Alternatively, WEHI 231 cells electroporated with control p3′SS were selected with hygromycin alone. (a) p21 protein analysis. Total proteins were prepared from pOPRSVI-p21 and control p3′SS transfected cells after treatment with 20 mM IPTG for 24 h, and samples (50 μg) were subjected to immunoblot analyses for expression of p21. (b) DNA ladder assay. Cultures of the control pOPRSVI-p21 and p3′SS transfected cells were treated with 20 mM IPTG for 24 h and analyzed for apoptosis by a DNA ladder assay. (c)Trypan blue staining. Cultures of the pOPRSVI-p21 and p3′SS transfected cells were treated in duplicate with 20 mM IPTG for 24 h, and extent of cell death was assessed by trypan blue staining. Data are plotted as the mean percentage of cells stained positive for trypan blue. The statistical significance was obtained using the Student's t test, and the vertical bars represent the standard deviation.
Figure 6
Figure 6
CD40L rescue of anti-IgM–induced apoptosis is accompanied by a block in induction of p21 expression. WEHI 231 cultures were treated with anti-IgM in the absence (−) or presence (+) of CD40L for the indicated times, and total cellular proteins were prepared and samples (20 μg) were subjected to immunoblot analysis for p21 expression.
Figure 7
Figure 7
Antisense p21 and antisense p27 expression ablates anti-IgM– induced apoptosis. (a) WEHI 231 cells were microinjected with the indicated plasmids at a concentration of 0.5 μg/μl, and with enough pBluescript plasmid to bring the final DNA concentration to 1.0 μg/μl. Immediately after microinjection, cells were treated with anti-IgM and cultured for 45 h, and cell viability was assessed by trypan blue staining. Data are presented as the mean of duplicates, with standard deviation indicated. This data represents one experiment that is typical of three independent experiments with essentially identical results. The total number of cells analyzed per treatment ranged from 163 (asp21 + asp27) to 231 (none). (b) WEHI 231 cells either were not microinjected (none) or were microinjected with 4 μg/μl. BSA or affinity-purified antibody against p21 protein in the absence or presence of 4 μg/μl cognate peptide or 4 μg/μl affinity-purified antibody against p27 protein. Immediately after microinjection, cells were treated with anti-IgM and cultured for 18 h, and cell viability was assessed by trypan blue staining. Data are presented as the mean of duplicates, with standard deviation indicated. This data represents one experiment that is typical of two independent experiments with essentially identical results. The total number of cells analyzed per treatment ranged from 135 (BSA) to 231 (anti-p21).
Figure 7
Figure 7
Antisense p21 and antisense p27 expression ablates anti-IgM– induced apoptosis. (a) WEHI 231 cells were microinjected with the indicated plasmids at a concentration of 0.5 μg/μl, and with enough pBluescript plasmid to bring the final DNA concentration to 1.0 μg/μl. Immediately after microinjection, cells were treated with anti-IgM and cultured for 45 h, and cell viability was assessed by trypan blue staining. Data are presented as the mean of duplicates, with standard deviation indicated. This data represents one experiment that is typical of three independent experiments with essentially identical results. The total number of cells analyzed per treatment ranged from 163 (asp21 + asp27) to 231 (none). (b) WEHI 231 cells either were not microinjected (none) or were microinjected with 4 μg/μl. BSA or affinity-purified antibody against p21 protein in the absence or presence of 4 μg/μl cognate peptide or 4 μg/μl affinity-purified antibody against p27 protein. Immediately after microinjection, cells were treated with anti-IgM and cultured for 18 h, and cell viability was assessed by trypan blue staining. Data are presented as the mean of duplicates, with standard deviation indicated. This data represents one experiment that is typical of two independent experiments with essentially identical results. The total number of cells analyzed per treatment ranged from 135 (BSA) to 231 (anti-p21).

References

    1. Boyd AW, Schrader JW. The regulation of growth and differentiation of a murine B-cell lymphoma. II. The inhibition of WEHI 231 by anti-immunoglobulin antibodies. J Immunol. 1981;126:2466–2469. - PubMed
    1. Monroe JG, Seyfert VL. Studies of surface immunoglobulin-dependent B cell activation. Immunol Res. 1988;7:136–151. - PubMed
    1. Ralph P. Functional subsets of murine and human B lymphocyte cell lines. Immunol Rev. 1979;48:107–121. - PubMed
    1. McCormack JE, Pepe VH, Kent RB, Dean M, Marshak-Rothstein A, Sonenshein GE. Specific regulation of c-myconcogene expression in a murine B-cell lymphoma. Proc Natl Acad Sci USA. 1984;811:5546–5550. - PMC - PubMed
    1. Benhamou LE, Cazenave P-A, Sarthou P. Anti-immunoglobulins induce death by apoptosis in WEHI 231 B lymphoma cells. Eur J Immunol. 1990;20:1405–1407. - PubMed

Publication types

MeSH terms