. 1998 May 18;141(4):875-85.
doi: 10.1083/jcb.141.4.875.

Nuclear localization of cyclin B1 controls mitotic entry after DNA damage

Affiliations

Nuclear localization of cyclin B1 controls mitotic entry after DNA damage

P Jin et al. J Cell Biol. .

Abstract

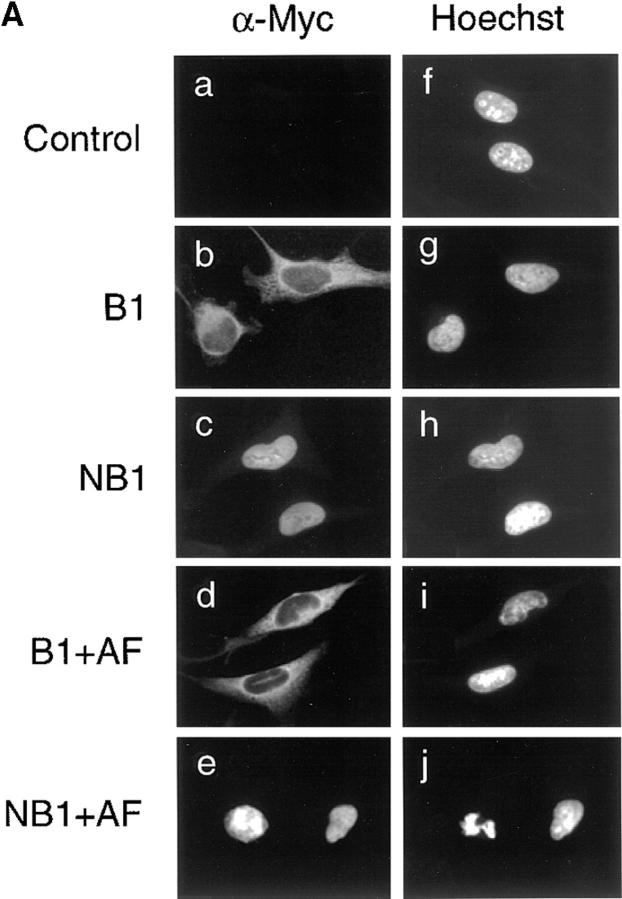
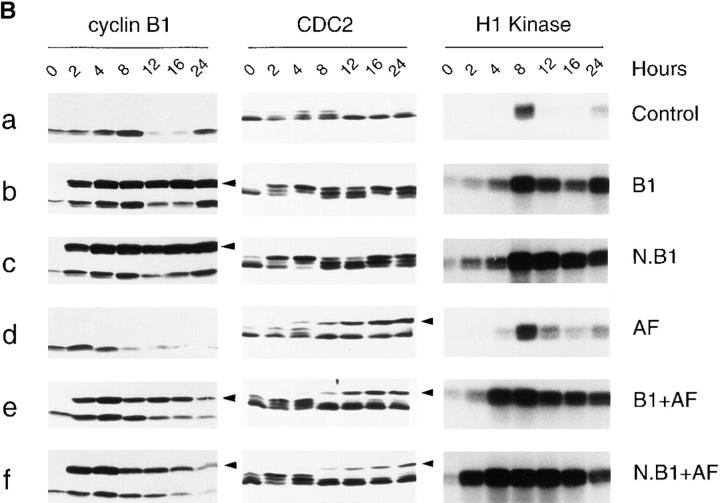
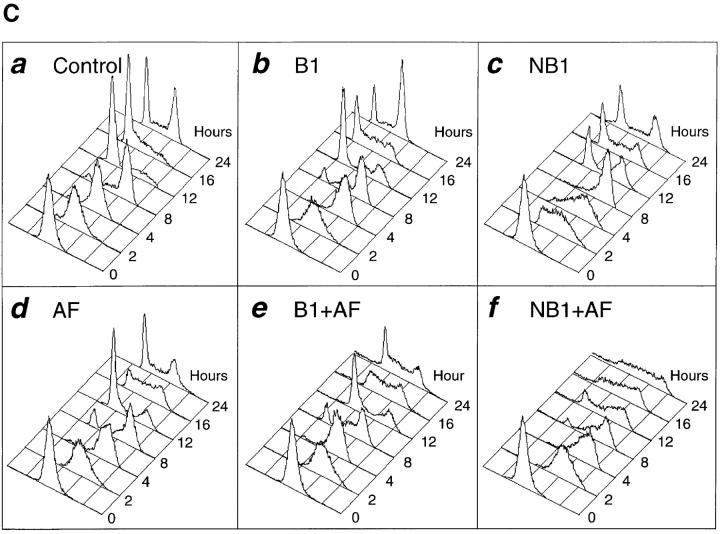
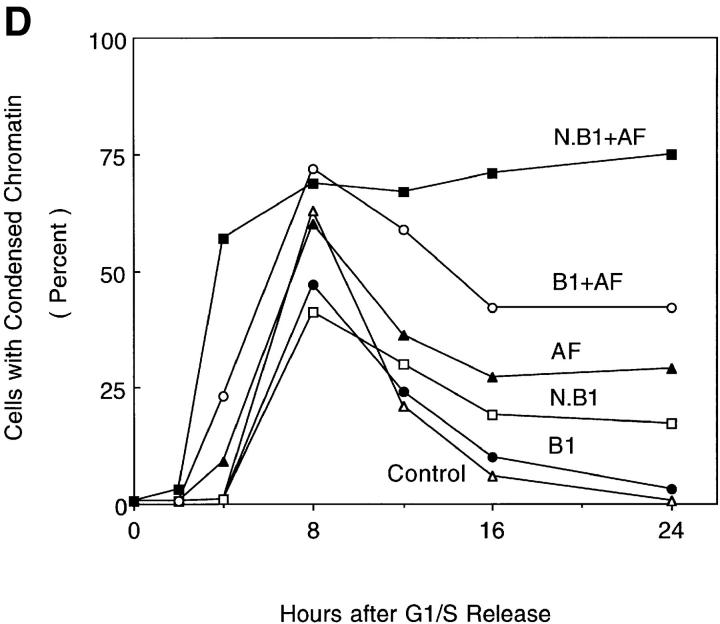
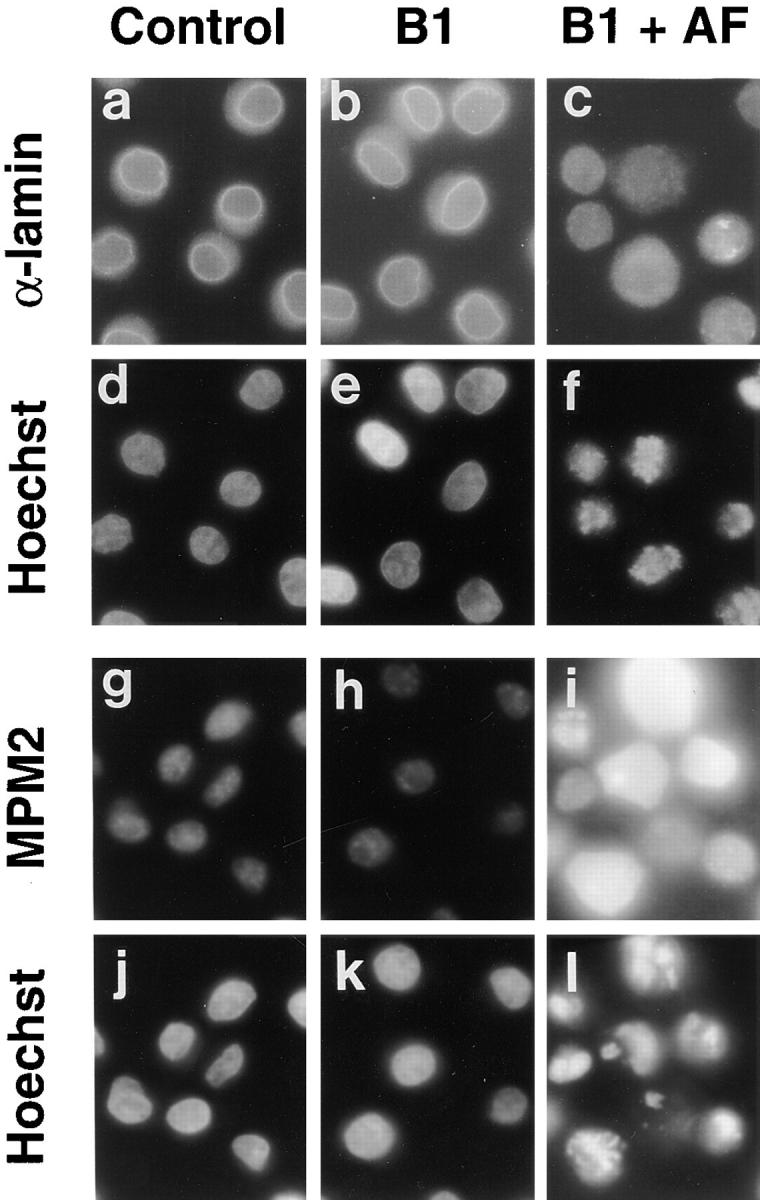
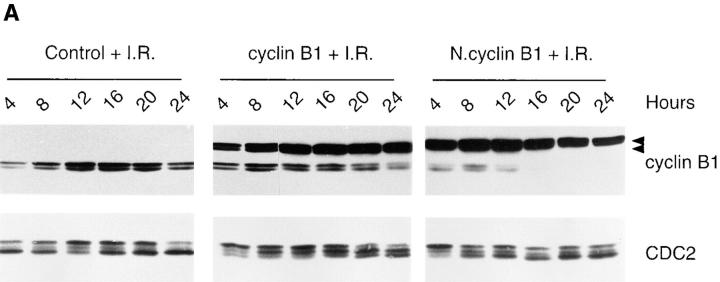
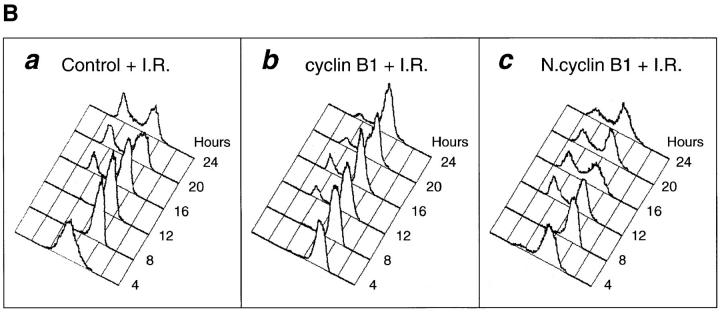
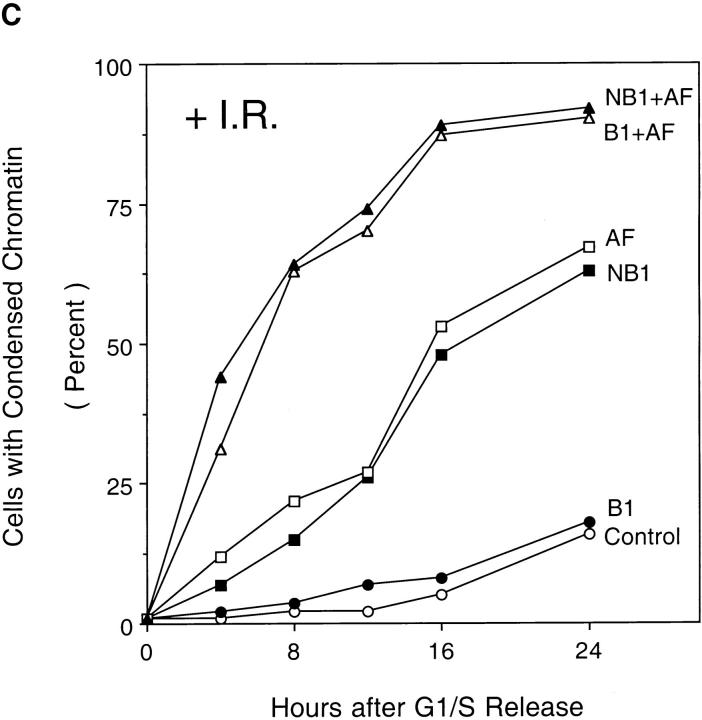
Mitosis in human cells is initiated by the protein kinase Cdc2-cyclin B1, which is activated at the end of G2 by dephosphorylation of two inhibitory residues, Thr14 and Tyr15. The G2 arrest that occurs after DNA damage is due in part to stabilization of phosphorylation at these sites. We explored the possibility that entry into mitosis is also regulated by the subcellular location of Cdc2-cyclin B1, which is suddenly imported into the nucleus at the end of G2. We measured the timing of mitosis in HeLa cells expressing a constitutively nuclear cyclin B1 mutant. Parallel studies were performed with cells expressing Cdc2AF, a Cdc2 mutant that cannot be phosphorylated at inhibitory sites. Whereas nuclear cyclin B1 and Cdc2AF each had little effect under normal growth conditions, together they induced a striking premature mitotic phenotype. Nuclear targeting of cyclin B1 was particularly effective in cells arrested in G2 by DNA damage, where it greatly reduced the damage-induced G2 arrest. Expression of nuclear cyclin B1 and Cdc2AF also resulted in significant defects in the exit from mitosis. Thus, nuclear targeting of cyclin B1 and dephosphorylation of Cdc2 both contribute to the control of mitotic entry and exit in human cells.


Figures

Figure 1
Figure 1
Effects of nuclear cyclin B1 and Cdc2AF on progression through mitosis. (A) HeLa cells were synchronized at the G1/S boundary by a double thymidine treatment and infected for 3 h with recombinant adenoviruses encoding the tTA transactivator (a and f, control) or with multiple viruses encoding tTA plus cyclin B1 (b and g, B1), NLS-cyclin B1 (c and h, NB1), both cyclin B1 and Cdc2AF (d and i, B1 + AF), or both NLS-cyclin B1 and Cdc2AF (e and j; NB1 + AF). 4 h after release from G1/S arrest, cells were subjected to secondary immunofluorescence analysis with an antibody against the Myc epitope tag on cyclin B1 (α-Myc; a–e) and treated with Hoechst 33258 to label nuclear DNA (f–j). (B) HeLa cells were synchronized at the G1/S boundary and infected for 4 h with recombinant adenoviruses encoding the tTA transactivator (a, Control) or with multiple viruses encoding tTA plus cyclin B1 (b, B1), NLS-cyclin B1 (c, N.B1), Cdc2AF (d, AF), both cyclin B1 and Cdc2AF (e, B1 + AF), or both NLS-cyclin B1 and Cdc2AF (f, N.B1 + AF). Cell lysates prepared at the indicated times after G1/S release were subjected to immunoblotting with antibodies against cyclin B1 (left), or antibodies against the PSTAIRE sequence conserved among CDKs (middle; Cdc2 is the major anti-PSTAIRE antigen in HeLa cells). Arrowheads indicate the epitope-tagged, virally-encoded cyclin B1, NLS-cyclin B1, and Cdc2AF proteins. Histone H1 kinase activity was measured in immunoprecipitates with anti-cyclin B1 (right); autoradiographic exposure times were 1.5 h. (C) Cells from the same experiment as in B were harvested at the indicated times, fixed, stained with propidium iodide, and analyzed by flow cytometry to measure DNA content. Abbreviations are as given in B. (D) A fraction of the cells prepared for flow cytometric analysis in C were examined by microscopy for the presence of condensed chromosomes. At least 300 cells were analyzed for each sample. These values represent the means of data obtained from two separate experiments, in which results were essentially identical. Abbreviations are as given in B.
Figure 1
Figure 1
Effects of nuclear cyclin B1 and Cdc2AF on progression through mitosis. (A) HeLa cells were synchronized at the G1/S boundary by a double thymidine treatment and infected for 3 h with recombinant adenoviruses encoding the tTA transactivator (a and f, control) or with multiple viruses encoding tTA plus cyclin B1 (b and g, B1), NLS-cyclin B1 (c and h, NB1), both cyclin B1 and Cdc2AF (d and i, B1 + AF), or both NLS-cyclin B1 and Cdc2AF (e and j; NB1 + AF). 4 h after release from G1/S arrest, cells were subjected to secondary immunofluorescence analysis with an antibody against the Myc epitope tag on cyclin B1 (α-Myc; a–e) and treated with Hoechst 33258 to label nuclear DNA (f–j). (B) HeLa cells were synchronized at the G1/S boundary and infected for 4 h with recombinant adenoviruses encoding the tTA transactivator (a, Control) or with multiple viruses encoding tTA plus cyclin B1 (b, B1), NLS-cyclin B1 (c, N.B1), Cdc2AF (d, AF), both cyclin B1 and Cdc2AF (e, B1 + AF), or both NLS-cyclin B1 and Cdc2AF (f, N.B1 + AF). Cell lysates prepared at the indicated times after G1/S release were subjected to immunoblotting with antibodies against cyclin B1 (left), or antibodies against the PSTAIRE sequence conserved among CDKs (middle; Cdc2 is the major anti-PSTAIRE antigen in HeLa cells). Arrowheads indicate the epitope-tagged, virally-encoded cyclin B1, NLS-cyclin B1, and Cdc2AF proteins. Histone H1 kinase activity was measured in immunoprecipitates with anti-cyclin B1 (right); autoradiographic exposure times were 1.5 h. (C) Cells from the same experiment as in B were harvested at the indicated times, fixed, stained with propidium iodide, and analyzed by flow cytometry to measure DNA content. Abbreviations are as given in B. (D) A fraction of the cells prepared for flow cytometric analysis in C were examined by microscopy for the presence of condensed chromosomes. At least 300 cells were analyzed for each sample. These values represent the means of data obtained from two separate experiments, in which results were essentially identical. Abbreviations are as given in B.
Figure 2
Figure 2
Cells coexpressing cyclin B1 and Cdc2AF arrest with a mitotic phenotype. HeLa cells arrested at the G1/S boundary were infected with tTA virus alone (left, control), tTA virus plus cyclin B1-expressing adenovirus (middle, B1), or tTA virus plus both cyclin B1- and Cdc2AF-expressing viruses (right, B1 + AF). 16 h after G1/S release, when control cells had entered the next G1 (see Fig. 1), cells were subjected to secondary immunofluorescence analysis with antibody against nuclear lamin A (a–c) or the MPM-2 antibody, which recognizes mitotic phosphoepitopes (g– i). The same cells were also stained with Hoechst 33258 to reveal chromosome morphology (d–f and j–l). At this time point, ∼50% of cells coexpressing cyclin B1 and Cdc2AF display the mitotic phenotype shown in the right panels (see Fig. 1).
Figure 3
Figure 3
Nuclear cyclin B1 reduces the G2 arrest after DNA damage. (A) HeLa cells synchronized at the G1/S boundary were infected with adenoviruses encoding tTA (left, control), tTA plus cyclin B1 (middle), or tTA plus NLS-cyclin B1 (right). 1 h after the G1/S release, cells were x-irradiated with ∼6 Gray. Cell lysates prepared at the indicated times were subjected to immunoblotting with anti- cyclin B1 (top) and anti-PSTAIRE antibodies (bottom). Arrowheads indicate virally-encoded cyclin B1 and NLS-tagged cyclin B1. I.R., ionizing radiation. (B) Half of the cells from the experiment in A were subjected to flow cytometric analysis of DNA content. (C) Samples of propidium iodide–stained cells from selected times points were analyzed by microscopy and photographed to illustrate the premature chromosome condensation morphology in cells expressing NLS-tagged cyclin B1. (D) Percentage of cells with premature chromosome condensation was determined by counting at least 300 cells for each sample. (E) A separate experiment was performed in which the microtubule-destabilizing drug nocodazole was added to the cell culture medium after the G1/S release; this results in accumulation of all cells in mitosis. The percentage of cells with premature chromosome condensation was quantitated as in D. Note that the radiation dose in this experiment was slightly greater than that in D, resulting in a more prolonged G2 arrest in control cells.
Figure 3
Figure 3
Nuclear cyclin B1 reduces the G2 arrest after DNA damage. (A) HeLa cells synchronized at the G1/S boundary were infected with adenoviruses encoding tTA (left, control), tTA plus cyclin B1 (middle), or tTA plus NLS-cyclin B1 (right). 1 h after the G1/S release, cells were x-irradiated with ∼6 Gray. Cell lysates prepared at the indicated times were subjected to immunoblotting with anti- cyclin B1 (top) and anti-PSTAIRE antibodies (bottom). Arrowheads indicate virally-encoded cyclin B1 and NLS-tagged cyclin B1. I.R., ionizing radiation. (B) Half of the cells from the experiment in A were subjected to flow cytometric analysis of DNA content. (C) Samples of propidium iodide–stained cells from selected times points were analyzed by microscopy and photographed to illustrate the premature chromosome condensation morphology in cells expressing NLS-tagged cyclin B1. (D) Percentage of cells with premature chromosome condensation was determined by counting at least 300 cells for each sample. (E) A separate experiment was performed in which the microtubule-destabilizing drug nocodazole was added to the cell culture medium after the G1/S release; this results in accumulation of all cells in mitosis. The percentage of cells with premature chromosome condensation was quantitated as in D. Note that the radiation dose in this experiment was slightly greater than that in D, resulting in a more prolonged G2 arrest in control cells.
Figure 4
Figure 4
Effects of nuclear cyclin B1 and Cdc2AF on the DNA damage response. (A) HeLa cells arrested at G1/S were infected with recombinant adenoviruses encoding tTA (a, control) or both tTA and the indicated proteins (b–f, abbreviated as in Fig. 1). 1 h after release from the G1/S block, cells were x-irradiated with ∼6 Gray. At the indicated times, cell lysates were prepared and subjected to immunoblotting with anti-cyclin B1 and anti-PSTAIRE antibodies. Arrowheads indicate virally encoded proteins. (B) Half of the cells from the experiment in A were fixed, stained with propidium iodide, and subjected to flow cytometry to determine DNA content. I.R., ionizing radiation. (C) Propidium iodide–stained cells from the analysis in B were examined by fluorescence microscopy, and the percentage of cells with premature chromosome condensation was determined by counting at least 300 cells per sample. In a parallel experiment, analysis of Myc-tagged cyclin localization confirmed that cyclin B1 and NLS-cyclin B1 were cytoplasmic and nuclear, respectively, in DNA-damaged interphase cells, either in the presence or absence of Cdc2AF (data not shown, but results were similar to those in Fig. 1 A).
Figure 4
Figure 4
Effects of nuclear cyclin B1 and Cdc2AF on the DNA damage response. (A) HeLa cells arrested at G1/S were infected with recombinant adenoviruses encoding tTA (a, control) or both tTA and the indicated proteins (b–f, abbreviated as in Fig. 1). 1 h after release from the G1/S block, cells were x-irradiated with ∼6 Gray. At the indicated times, cell lysates were prepared and subjected to immunoblotting with anti-cyclin B1 and anti-PSTAIRE antibodies. Arrowheads indicate virally encoded proteins. (B) Half of the cells from the experiment in A were fixed, stained with propidium iodide, and subjected to flow cytometry to determine DNA content. I.R., ionizing radiation. (C) Propidium iodide–stained cells from the analysis in B were examined by fluorescence microscopy, and the percentage of cells with premature chromosome condensation was determined by counting at least 300 cells per sample. In a parallel experiment, analysis of Myc-tagged cyclin localization confirmed that cyclin B1 and NLS-cyclin B1 were cytoplasmic and nuclear, respectively, in DNA-damaged interphase cells, either in the presence or absence of Cdc2AF (data not shown, but results were similar to those in Fig. 1 A).

Similar articles

Cited by

References

    1. Bailly E, Pines J, Hunter T, Bornens M. Cytoplasmic accumulation of cyclin B1 in human cells: association with a detergent-resistant compartment and the centrosome. J Cell Sci. 1992;101:529–545. - PubMed
    1. Blasina A, Paegle ES, McGowan CH. The role of inhibitory phosphorylation of CDC2 following DNA replication block and radiation- induced damage in human cells. Mol Biol Cell. 1997;8:1013–1023. - PMC - PubMed
    1. Dunphy WG. The decision to enter mitosis. Trends Cell Biol. 1994;4:202–207. - PubMed
    1. Edgar BA, O'Farrell PH. Genetic control of cell division patterns in the Drosophilaembryo. Cell. 1989;57:177–187. - PMC - PubMed
    1. Edgar BA, O'Farrell PH. The three postblastoderm cell cycles of Drosophila embryogenesis are regulated in G2 by string. . Cell. 1990;62:469–480. - PMC - PubMed

Publication types

MeSH terms