. 1998 Jun 1;18(11):4244-54.
doi: 10.1523/JNEUROSCI.18-11-04244.1998.

Induced gamma-band activity during the delay of a visual short-term memory task in humans

Affiliations

Induced gamma-band activity during the delay of a visual short-term memory task in humans

C Tallon-Baudry et al. J Neurosci. .

Abstract

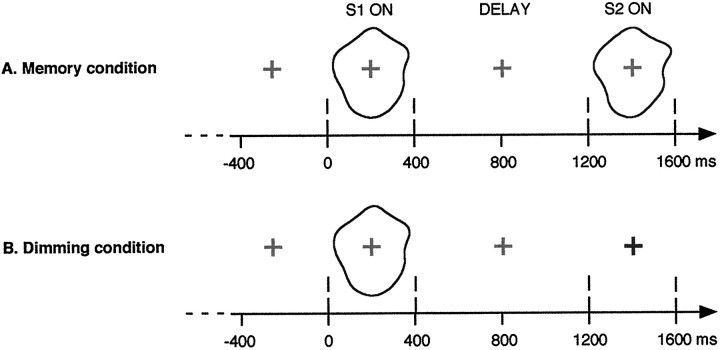
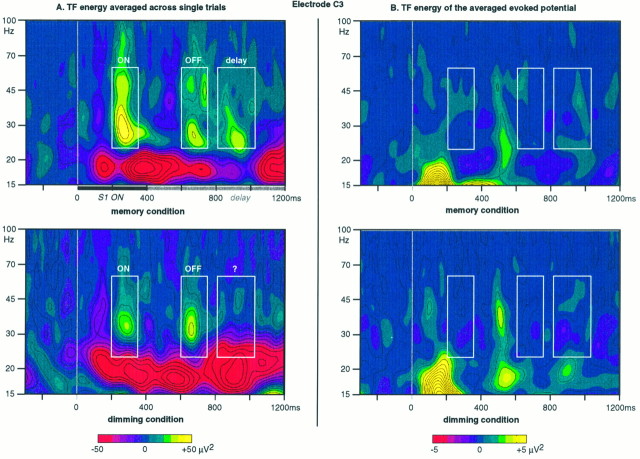
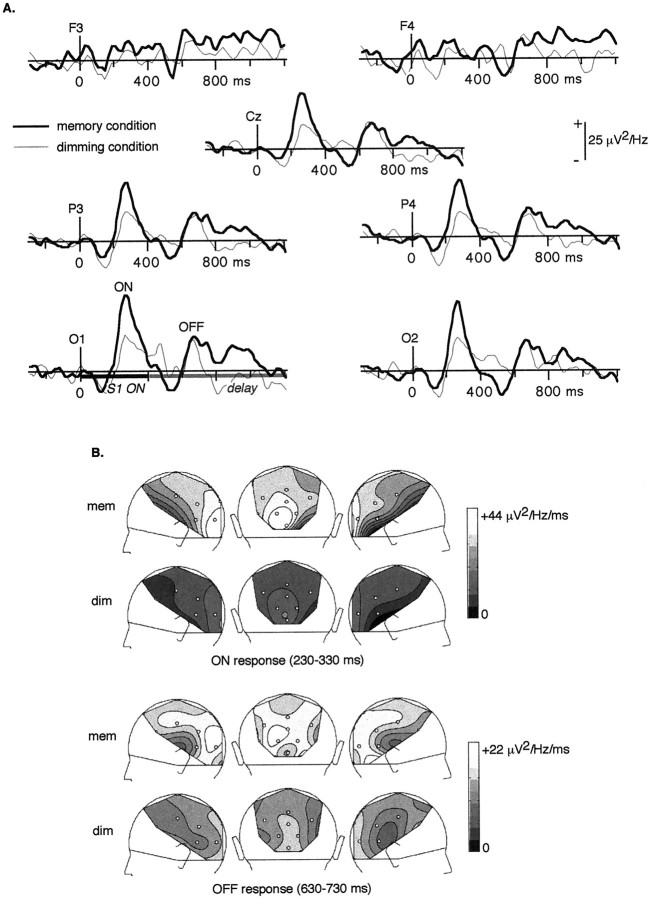
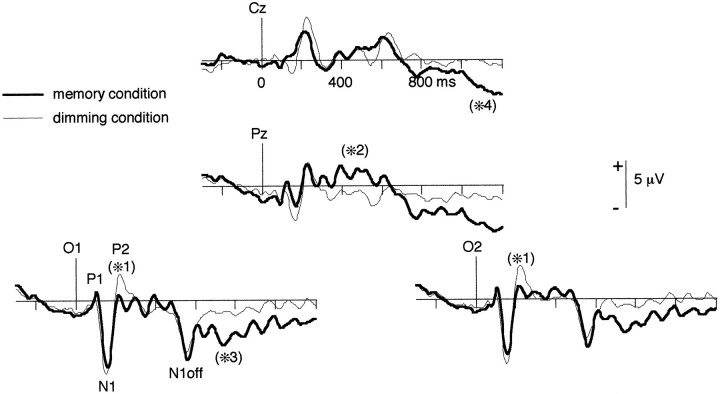
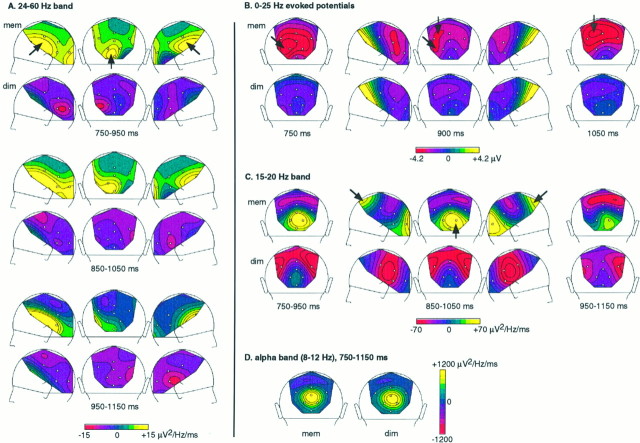
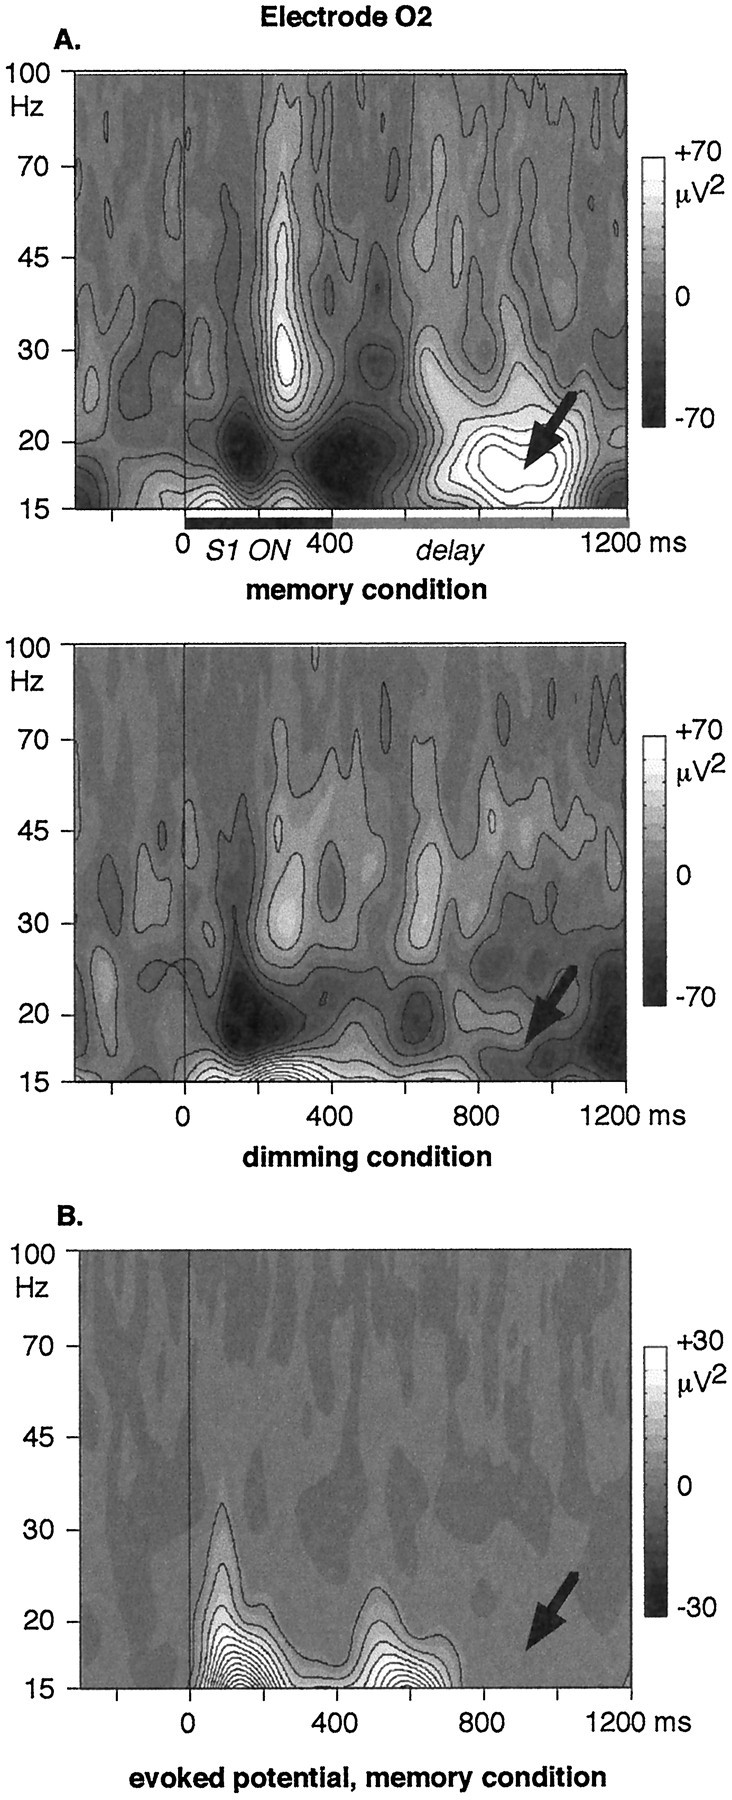
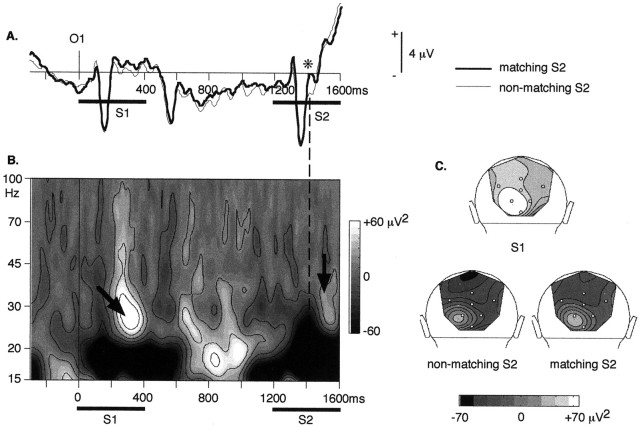
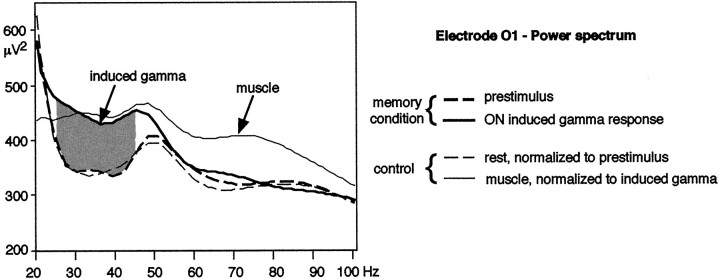
It has been hypothesized that visual objects could be represented in the brain by a distributed cell assembly synchronized on an oscillatory mode in the gamma-band (20-80 Hz). If this hypothesis is correct, then oscillatory gamma-band activity should appear in any task requiring the activation of an object representation, and in particular when an object representation is held active in short-term memory: sustained gamma-band activity is thus expected during the delay of a delayed-matching-to-sample task. EEG was recorded while subjects performed such a task. Induced (e.g., appearing with a jitter in latency from one trial to the next) gamma-band activity was observed during the delay. In a control task, in which no memorization was required, this activity disappeared. Furthermore, this gamma-band activity during the rehearsal of the first stimulus representation in short-term memory peaked at both occipitotemporal and frontal electrodes. This topography fits with the idea of a synchronized cortical network centered on prefrontal and ventral visual areas. Activities in the alpha band, in the 15-20 Hz band, and in the averaged evoked potential were also analyzed. The gamma-band activity during the delay can be distinguished from all of these other components of the response, on the basis of either its variations or its topography. It thus seems to be a specific functional component of the response that could correspond to the rehearsal of an object representation in short-term memory.


Figures

Fig. 1.
Fig. 1.
Experimental design. In the memory condition, two stimuli, S1 and S2, were presented for 400 msec separated by a 800 msec delay. Subjects were to detect matching S2 (20% of the trials). In the dimming condition, no second stimulus appeared. Instead, the fixation cross could either dim (80% of the trials) or remain the same (20%), in which case subjects had to respond. In this control condition, S1 does not have to be memorized and acts only as a warning stimulus. These two conditions were presented in two successive recording sessions. We expected to find induced γ-band activity reflecting S1 representation rehearsal during the delay in the memory condition but not in the dimming condition.
Fig. 2.
Fig. 2.
A, Time–frequency (TF) representation of the energy averaged across single trials at electrode C3, grand average across subjects, in both conditions. Time is presented on the x-axis. Frequency is presented on the y-axis on a logarithmic scale. The energy level is coded on a color scale: yellow areas show an enhancement of energy compared with prestimulus level, andred areas show decrease. Three areas of enhanced high-frequency activity can be observed (white boxes): (1) an ON response, peaking at ∼280 msec and 30 Hz, higher in the memory than in the dimming condition; (2) an OFF response, peaking at ∼680 msec (e.g., 280 msec after S1 offset), similar in both conditions; and (3) a γ-band activity during the delay, in the memory condition only. B, Time–frequency (TF) representation of the energy of the averaged evoked potential at electrode C3, grand average across subjects, in both conditions. Only activities phase-locked to stimulus onset (e.g., appearing at a fixed latency from one trial to the next) can be observed on these representations. The three areas of enhanced high-frequency activity in A thus correspond to induced activities (e.g., appearing with a latency jitter from one trial to the next).
Fig. 3.
Fig. 3.
A, Energy of the mean activity between 24 and 60 Hz, grand average across subjects, in the memory (thick line) and in the dimming (thin line) conditions. A first peak of enhanced γ-band activity appears at ∼280 msec (ON). It is significantly stronger in the memory than in the dimming condition. An OFF response can be observed at ∼680 msec (e.g., 280 msec after S1 offset); it does not show any significant difference between conditions. Later on, during the delay, a sustained γ-band activity appears in the memory condition only, mainly at left posterior electrodes and bilaterally at frontal electrodes. It tends to decrease before the end of the delay.B, Topographical maps of the 24–60 Hz energy (left, back, and right views of the head) averaged between 230 and 330 msec (ON response), and between 630 and 730 msec (OFF response). In both conditions, the ON response is maximum over occipital electrodes and decreases smoothly until the frontal sites. It is not only enhanced but also lateralized over the left hemisphere in the memory condition. The topography of the OFF response is less clear-cut; it tends to be maximum over occipital sites also. No tendency for lateralization of the OFF response could be found in any condition.
Fig. 4.
Fig. 4.
Filtered (0–25 Hz) averaged evoked potentials, grand average across subjects, in the memory (thick line) and in the dimming (thin line) conditions. The first significant difference (*1) between the two conditions occurs at 200–240 msec: the posterior P2 component is more pronounced in the dimming condition. Later on (300–550 msec), a sustained positivity appears at electrodes POz (not shown) and Pz (*2) in the memory condition. During the delay, a negativity appears at left occipitotemporal sites (O1, *3) in the memory condition and tends to decrease in the end of the delay, whereas a parietocentral negativity rises (Cz, *4). See also the maps of the 0–25 Hz evoked potential during the delay in Figure5B.
Fig. 5.
Fig. 5.
Summary of the activities observed during the delay. A, γ-band (24–60 Hz) energy in the memory (top row) and in the dimming condition (bottom row), averaged on three overlapping 200-msec time windows (750–950, 850–1050, and 950–1150 msec). Topographical maps of left, back, and right views of the head are displayed for these three time windows. Enhanced γ-band activity appears in the memory condition at left posterior electrodes, and bilaterally at more frontal sites (arrows). Differences between conditions are more significant at the beginning of the delay (750–950 and 850–1050 msec time windows) than in the end (950–1150 msec). B, Topographical maps of the evoked potential in both conditions, at three latencies (700, 900, and 1050 msec). Two negativities with different time courses and topographies can be observed in the memory condition (arrows): a left posterior negativity is prominent at the beginning of the delay and decreases in the end of the delay, whereas a parietocentral negativity rises. C, Energy (15–20 Hz) averaged in three 200 msec time windows in both conditions. An occipital enhancement, with a tendency for being lateralized on the right, is observed in the memory condition. Another peak of 15–20 Hz activity is observed in the memory condition at the midline frontal electrode. D, Energy in the α-band (8–12 Hz), averaged between 750 and 1150 msec. No difference between the two conditions could be detected in this frequency band during the delay.
Fig. 6.
Fig. 6.
A, Time–frequency energy averaged across single trials at electrode O2, in the memory (top) and in the dimming (bottom) conditions. Sustained 15–20 Hz activity is observed during the delay in the memory condition only (arrows). B, Time–frequency energy of the averaged evoked potential at electrode O2, in the memory condition. The 15–20 Hz energy observed during the delay disappears: it is an induced activity.
Fig. 7.
Fig. 7.
Responses to the matching and nonmatching S2 in the memory condition. A, Evoked (0–25 Hz) potentials at electrode O1, for matching (thin line) and nonmatching (thick line) S2. The first significant difference occurs around 1410 msec (*), e.g., 210 msec after S2 onset. B, Time–frequency representation of the energy averaged across single trials at electrode O1, in the memory condition, trials with nonmatching S2. A small γ-band response to S2 can be observed at ∼1500 msec (300 msec after S2 onset); it is much smaller than the ON response to S1. C, Topographical maps at 28 Hz (back views) of the ON response to S1 (top), of the ON response to nonmatching S2 (bottom left), and of the ON response to matching S2 (bottom right). In both cases (matching or nonmatching S2), the ON response to S2 is much smaller than the response to S1. Nevertheless, it shows the same left occipital maximum.
Fig. 8.
Fig. 8.
Power spectrum of the ON induced γ response compared with muscle activity (one subject, electrode O1 referenced to the nose). The subject was first recorded while performing the memory task. Comparison of the spectrum of the prestimulus (−350 to −50 msec) to the spectrum of the ON induced γ-band response (270–320 msec) reveals a difference around 35 Hz (gray area), whereas above 55 Hz, both spectra are similar. The ON induced γ response is thus confined to a narrow frequency band. The subject was then recorded while simply fixating on the screen, both at rest and when contracting different muscles (neck, jaw, eyebrow). The power spectrum at rest was lower than during the prestimulus of the memory condition, but with a similar profile. To get rid of scaling effects, the power spectrum at rest was normalized with respect to the 24–46 Hz band of the power spectrum of the prestimulus. Similarly, the power spectrum of muscle activity was normalized with respect to the 24–46 Hz band of the ON induced response power spectrum. It clearly appears that the effect of muscle activity is not restricted to this 24–46 Hz band, but extends up to 100 Hz. The same type of spectrum is observed when the different muscles (neck, jaw, eyebrow) are activated separately.

Similar articles

Cited by

References

    1. Anllo-Vento L, Hillyard SA. Selective attention to the color and direction of moving stimuli: electrophysiological correlates of hierarchical feature selection. Percept Psychophys. 1996;58:191–206. - PubMed
    1. Begleiter H, Porjesz B, Wang W. A neurophysiologic correlate of visual short-term memory in humans. Electroenceph Clin Neurophysiol. 1993;87:46–53. - PubMed
    1. Brosch M, Bauer R, Eckhorn R. Stimulus-dependent modulations of correlated high-frequency oscillations in cat visual cortex. Cereb Cortex. 1997;7:70–76. - PubMed
    1. Courtney SM, Ungerleider LG, Keil K, Haxby JV. Object and spatial visual working memory activate separate neural systems in human cortex. Cereb Cortex. 1996;6:39–49. - PubMed
    1. Desimone R. Neural mechanisms for visual memory and their role in attention. Proc Natl Acad Sci USA. 1996;93:13494–13499. - PMC - PubMed

Publication types

LinkOut - more resources