. 1998 May;42(5):1005-11.
doi: 10.1128/AAC.42.5.1005.

Characteristics and dynamics of bacterial populations during postantibiotic effect determined by flow cytometry

Affiliations

Characteristics and dynamics of bacterial populations during postantibiotic effect determined by flow cytometry

M Gottfredsson et al. Antimicrob Agents Chemother. 1998 May.

Abstract

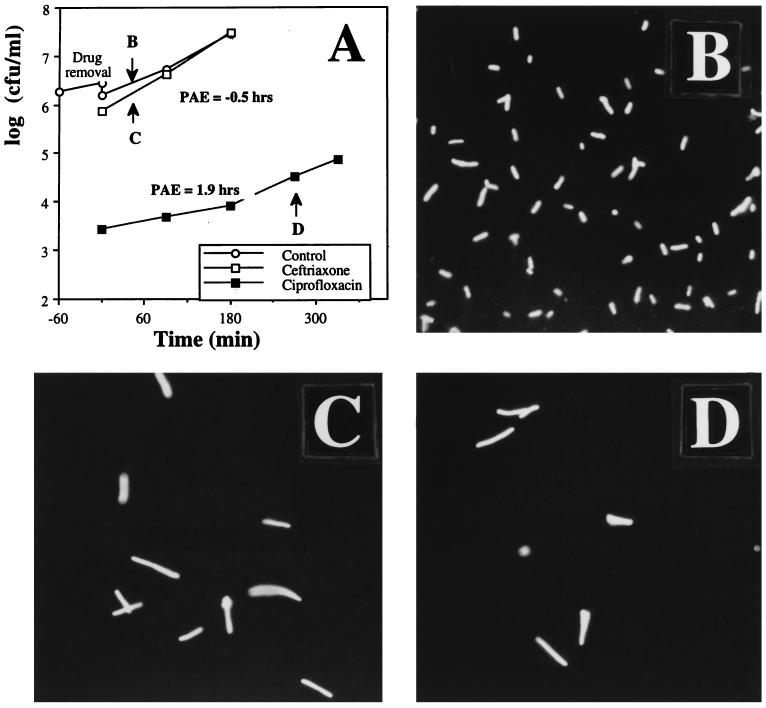
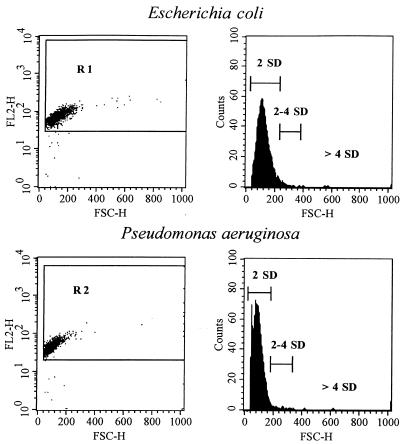
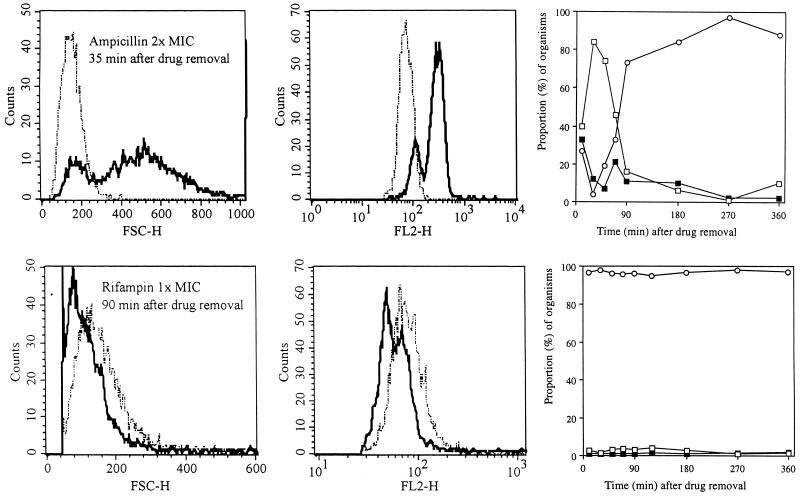
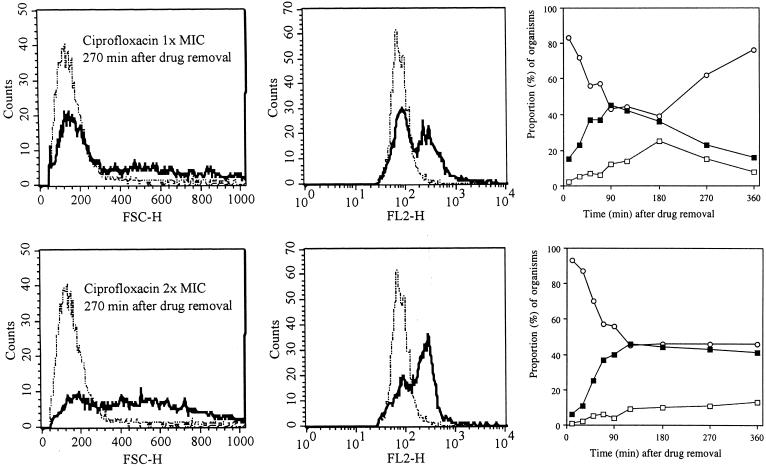
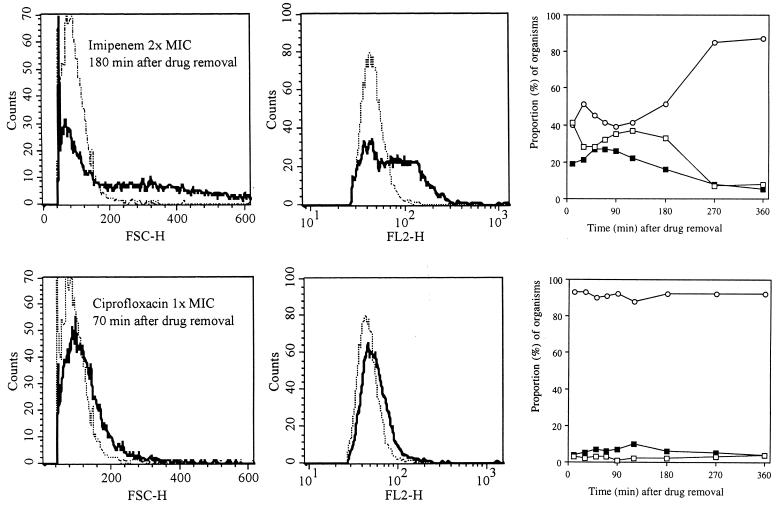
Changes in bacterial ultrastructure after antibiotic exposure and during the postantibiotic effect (PAE) have been demonstrated by electron microscopy (EM). However, EM is qualitative and subject to individual interpretation. In contrast, flow cytometry gives qualitative and quantitative information. The sizes and nucleic acid contents of Escherichia coli and Pseudomonas aeruginosa were studied during antimicrobial exposure as well as during the PAE period by staining the organisms with propidium iodide and analyzing them with flow cytometry and fluorescence microscopy. The effects of ampicillin, ceftriaxone, ciprofloxacin, gentamicin, and rifampin were studied for E. coli, whereas for P. aeruginosa imipenem and ciprofloxacin were investigated. After exposure of E. coli to ampicillin, ceftriaxone, and ciprofloxacin, filamentous organisms were observed by fluorescence microscopy. These changes in morphology were reflected by increased forward light scatter (FSC) and nucleic acid content as measured by flow cytometry. For the beta-lactams the extent of filamentation increased in a dose-dependent manner after drug removal, resulting in formation of distinct subpopulations of bacteria. These changes peaked at 20 to 35 min, and bacteria returned to normal after 90 min after drug removal. In contrast, the subpopulations induced by ciprofloxacin did not return to normal until > 180 min after the end of the classically defined PAE. Rifampin resulted in formation of small organisms with low FSC, whereas no distinctive characteristics were noted after gentamicin exposure. For P. aeruginosa an identifiable subpopulation of large globoid cells and increased nucleic acid content was detected after exposure to imipenem. These changes persisted past the PAE, as defined by viability counting. Swollen organisms with increased FSC were detected after ciprofloxacin exposure, even persisting during bacterial growth. In summary, for beta-lactam antibiotics and ciprofloxacin, the PAE is characterized by dynamic formation of enlarged cell populations of increased nucleic acid content, whereas rifampin induces a decrease in size and nucleic acid content in the organisms. Flow cytometry is an ideal method for future studies of bacterial phenotypic characteristics during the PAE.


Figures

FIG. 1
FIG. 1
(A) A typical PAE experiment for E. coli ATCC 25922 after exposure to ceftriaxone or ciprofloxacin (each at a concentration equivalent to twice the MIC), as determined by viability counting. As shown, no PAE was seen after ceftriaxone exposure, but ciprofloxacin induced a PAE of 1.9 h. The organisms were stained with propidium iodide and examined by fluorescence microscopy. (B through D) Photomicrographs of untreated control organisms (B), ceftriaxone-exposed organisms 35 min after drug removal (C), and ciprofloxacin-exposed organisms 270 min after drug removal (D). Both antibiotics induced filamentation, but this morphological form persisted past the classically defined PAE in organisms exposed to ciprofloxacin. Magnification, ×880.
FIG. 2
FIG. 2
(Left panels) Dot plots of FSC peak height (shown as FSC-H), indicative of size, and FL2 peak height (shown as FL2-H), indicative of double-stranded nucleic acid content, for the untreated control organisms E. coli ATCC 25922 and P. aeruginosa ATCC 27853 in the logarithmic-growth phase. The gates used are also shown (R1 for E. coli and R2 for P. aeruginosa). (Right panels) Histograms for bacterial size (FSC-H), with three intervals, representing 2 SDs (97.4th percentile), 2 to 4 SDs (97.4th to 99.2th percentile), and >4 SDs (>99.2th percentile) of the control size distribution. These intervals were used for comparisons between controls and antibiotic-exposed organisms.
FIG. 3
FIG. 3
Histograms showing a comparison of the size distribution (FSC-H) (left panels) and nucleic acid content (FL2-H) (middle panels) of E. coli during the PAE after exposure to ampicillin at a concentration equivalent to twice the MIC at 35 min after drug removal and after exposure to rifampin at a concentration equivalent to the MIC (lower panels) at 90 min after drug removal. Dotted-and-dashed lines, control organisms; solid lines, organisms previously exposed to the antibiotics. (Upper right graph) Progressive changes in size, compared to sizes of control organisms, as a function of time after previous exposure to ampicillin. (Lower right graph) Summary of the minimal changes in size that were noted after previous exposure to rifampin. The sizes of the antibiotic-treated organisms were compared to three size intervals derived from the control, which are described in text and shown in Fig. 2. Open circles, bacteria in the PAE phase which were within 2 SDs of control size; solid squares, bacteria within 2 to 4 SDs; open squares, organisms >4 SDs from the control distribution.
FIG. 4
FIG. 4
Histograms showing a comparison of the size distributions (FSC-H; left panels) and nucleic acid contents (FL2-H; middle panels) of E. coli during the PAE after exposure to ciprofloxacin at a concentration equivalent to the MIC and at a concentration equivalent to twice the MIC at 270 min after drug removal. Dotted-and-dashed lines, control organisms; solid lines, bacteria previously exposed to ciprofloxacin. Graphs (right panels) show progressive changes in size compared to sizes of controls. The sizes of antibiotic-treated organisms were compared to three control size intervals described in the text and shown in Fig. 2. Open circles, bacteria within 2 SDs of control size; solid squares, bacteria within 2 to 4 SDs; open squares, organisms >4 SDs from the control distribution.
FIG. 5
FIG. 5
Histograms showing the size distributions (FSC-H; left panels) and nucleic acid contents (FL2-H; middle panels) of P. aeruginosa during the PAE after exposure to imipenem at a concentration equivalent to twice the MIC and to ciprofloxacin at a concentration equivalent to the MIC at 180 and 70 min after drug removal, respectively. Dotted-and-dashed lines, control organisms; solid lines, antibiotic-exposed organisms. The graphs (right panels) show progressive changes in size compared to sizes of controls. The sizes of antibiotic-treated organisms were compared to three control size intervals described in text and shown in Fig. 2. Open circles, bacteria within 2 SDs of control size; solid squares, bacteria within 2 to 4 SDs; open squares, organisms >4 SDs from the control distribution.

References

    1. Ali M Z, Goetz M B. A meta-analysis of the relative efficacy and toxicity of single daily dosing versus multiple daily dosing of aminoglycosides. Clin Infect Dis. 1997;24:796–809. - PubMed
    1. Bailey T C, Little J R, Littenberg B, Reichley R M, Dunagan W C. A meta-analysis of extended-interval dosing versus multiple daily dosing of aminoglycosides. Clin Infect Dis. 1997;24:786–795. - PubMed
    1. Barmada S, Kohlhepp S, Leggett J, Dworkin R, Gilbert D. Correlation of tobramycin-induced inhibition of protein synthesis with postantibiotic effect in Escherichia coli. Antimicrob Agents Chemother. 1993;37:2678–2683. - PMC - PubMed
    1. Bigger J W. The bactericidal action of penicillin on Staphylococcus pyogens. Ir J Med Sci. 1944;227:533–568.
    1. Boswell F J, Andrews J M, Gill M J, Wise R. Postantibiotic effect of three carbapenems on Pseudomonas aeruginosa in the presence of lysine. J Antimicrob Chemother. 1995;35:232–233. - PubMed

Publication types

MeSH terms

Substances