. 1998 Jun;66(6):2836-44.
doi: 10.1128/IAI.66.6.2836-2844.1998.

Pasteurella haemolytica A1-derived leukotoxin and endotoxin induce intracellular calcium elevation in bovine alveolar macrophages by different signaling pathways

Affiliations

Pasteurella haemolytica A1-derived leukotoxin and endotoxin induce intracellular calcium elevation in bovine alveolar macrophages by different signaling pathways

S L Hsuan et al. Infect Immun. 1998 Jun.

Abstract

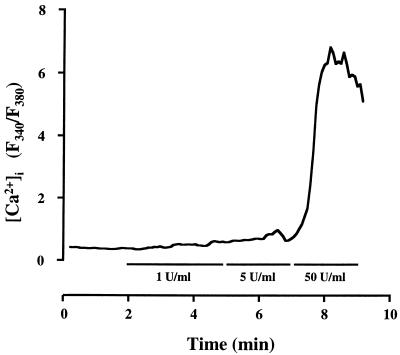
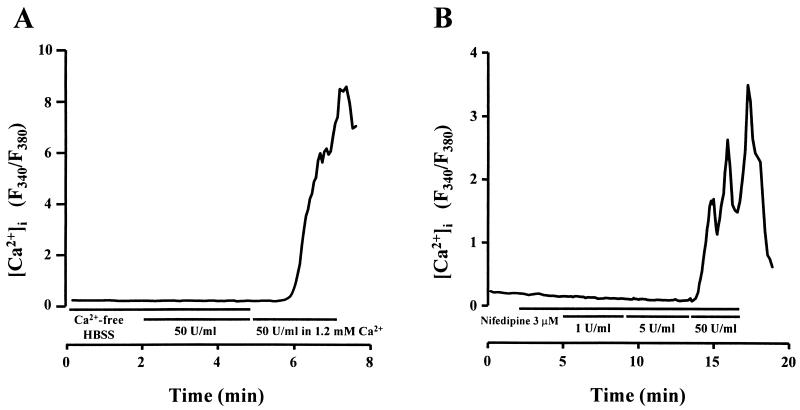
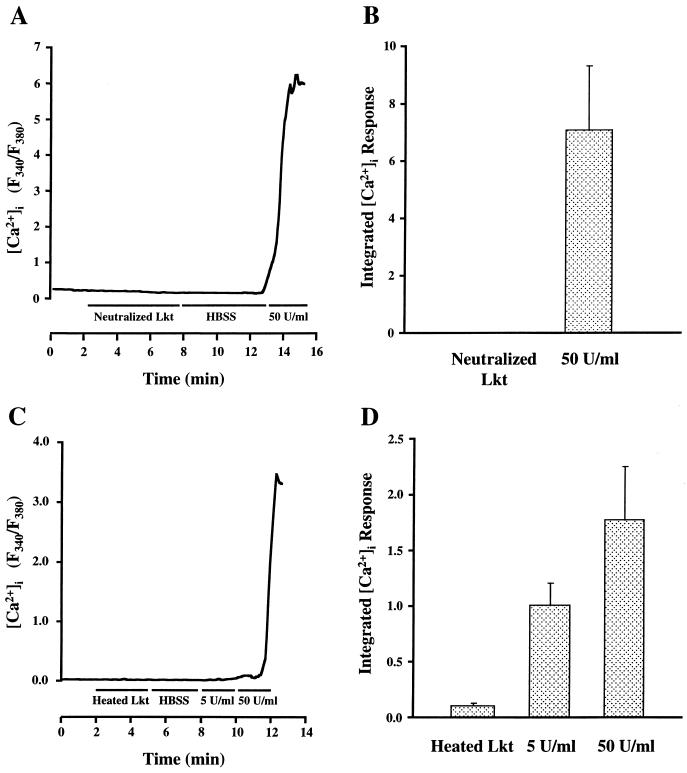
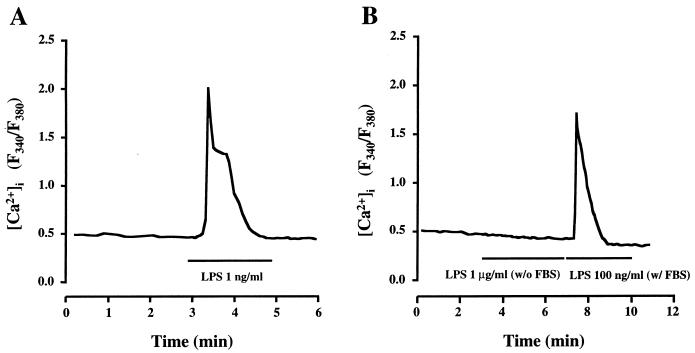
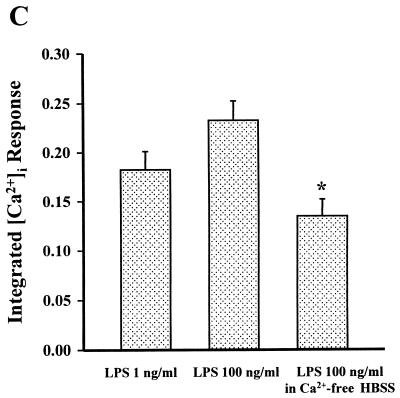
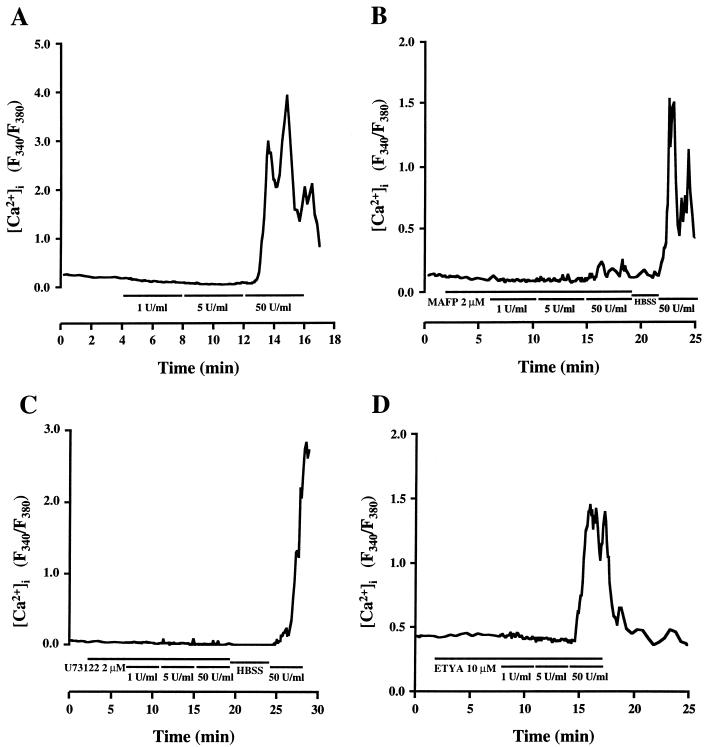
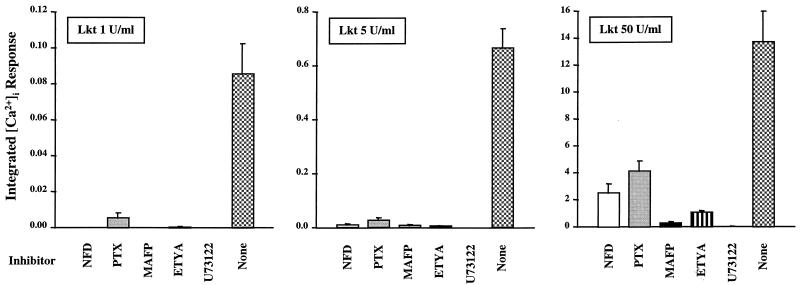
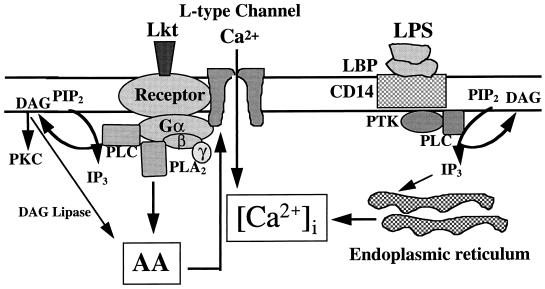
Leukotoxin and endotoxin derived from Pasteurella haemolytica serotype 1 are the primary virulence factors contributing to the pathogenesis of lung injury in bovine pneumonic pasteurellosis. Activation of bovine alveolar macrophages with endotoxin or leukotoxin results in the induction of cytokine gene expression, with different kinetics (H. S. Yoo, S. K. Maheswaran, G. Lin, E. L. Townsend, and T. R. Ames, Infect. Immun. 63:381-388, 1995; H. S. Yoo, B. S. Rajagopal, S. K. Maheswaran, and T. R. Ames, Microb. Pathog. 18:237-252, 1995). Furthermore, extracellular Ca2+ is required for leukotoxin-induced cytokine gene expression. However, the involvement of Ca2+ in endotoxin effects and the precise signaling mechanisms in the regulation of intracellular Ca2+ by leukotoxin and endotoxin are not known. In fura-2-acetoxymethyl ester-loaded alveolar macrophages, intracellular Ca2+ regulation by leukotoxin and endotoxin was studied by video fluorescence microscopy. Leukotoxin induced a sustained elevation of intracellular Ca2+ in a concentration-dependent fashion by influx of extracellular Ca2+ through voltage-gated channels. In the presence of fetal bovine serum, endotoxin elevated intracellular Ca2+ even in the absence of extracellular Ca2+. Leukotoxin-induced intracellular Ca2+ elevation was inhibited by pertussis toxin, inhibitors of phospholipases A2 and C, and the arachidonic acid analog 5,8,11,14-eicosatetraynoic acid. Intracellular Ca2+ elevation by endotoxin was inhibited by inhibitors of phospholipase C and protein tyrosine kinase, but not by pertussis toxin, or the arachidonic acid analog. To the best of our knowledge, this is the first report of Ca2+ signaling by leukotoxin through a G-protein-coupled mechanism involving activation of phospholipases A2 and C and release of arachidonic acid in bovine alveolar macrophages. Ca2+ signaling by endotoxin, on the other hand, involves activation of phospholipase C and requires tyrosine phosphorylation. The differences in the Ca2+ signaling mechanisms may underlie the reported temporal differences in gene expression during leukotoxin and endotoxin activation.


Figures

FIG. 1
FIG. 1
Trace showing the effects of different Lkt concentrations on [Ca2+]i elevation in fura 2-loaded BAMs. Note the rapid [Ca2+]i response to 50 U of Lkt per ml. Lkt effects were studied in the presence of 10 μg of polymyxin B per ml to block the effects of any contaminating LPS in the Lkt preparations used. The cells were exposed to 1, 5, and 50 U of Lkt per ml in a cumulative manner, i.e., no washing between exposures (n = 80 cells).
FIG. 2
FIG. 2
Representative traces showing the effect of extracellular Ca2+ removal (A) or nifedipine (B) on Lkt-induced [Ca2+]i elevation in fura 2-loaded BAMs. In BAMs exposed to nominally Ca2+-free HBSS, there is no elevation of [Ca2+]i to Lkt, even up to 50 U/ml. Subsequent exposure to Lkt in Ca2+-containing HBSS resulted in an elevation of [Ca2+]i, as shown in panel A. In BAMs preexposed to nifedipine to block voltage-gated channels, the responses to 1 and 5 U of Lkt per ml are blocked, while the response to 50 U of Lkt per ml is significantly attenuated, as shown in panel B. In panels A and B, 64 and 66 cells, respectively, were used.
FIG. 3
FIG. 3
(A) Representative trace shows that neutralized Lkt (50 U/ml) does not elicit a [Ca2+]i response. After the cells were washed with HBSS, subsequent exposure to 50 U of bioactive Lkt per ml elicits an elevation of [Ca2+]i. (B) Integrated [Ca2+]i response to neutralized and bioactive Lkt in BAMs, represented as the area under the F340/F380 curve (n = 30 cells). (C) Representative trace shows that heat-inactivated Lkt (50 U/ml) does not elicit a [Ca2+]i elevation, while subsequent exposure to 5 and 50 U of bioactive Lkt per ml, following a brief period of washing with HBSS, elicits an elevation of [Ca2+]i. (D) Integrated [Ca2+]i response to heat-inactivated and bioactive Lkt in BAMs, represented as the area under the F340/F380 curve. Note that the responses to bioactive Lkt are significantly attenuated than those of the controls (see Fig. 7) in these cells (n = 42 cells).
FIG. 4
FIG. 4
[Ca2+]i response in BAMs to LPS. (A) Trace showing the response to 1 ng of LPS per ml in the presence of 5% FBS (n = 50 cells). (B) Representative trace showing no elevation of [Ca2+]i even up to 1 μg of LPS per ml in the absence of FBS (n = 50 cells). Subsequent addition of 5% FBS resulted in an elevation of [Ca2+]i. (C) Integrated [Ca2+]i response of BAMs to LPS (1 or 100 ng/ml) (n = 129 cells) and the response to 100 ng of LPS per ml in nominally Ca2+-free HBSS (n = 62 cells). Note that there is no significant difference in the responses to the two concentrations of LPS. However, the response in nominally Ca2+-free HBSS is significantly attenuated. The asterisk denotes statistical significance (P < 0.05).
FIG. 4
FIG. 4
[Ca2+]i response in BAMs to LPS. (A) Trace showing the response to 1 ng of LPS per ml in the presence of 5% FBS (n = 50 cells). (B) Representative trace showing no elevation of [Ca2+]i even up to 1 μg of LPS per ml in the absence of FBS (n = 50 cells). Subsequent addition of 5% FBS resulted in an elevation of [Ca2+]i. (C) Integrated [Ca2+]i response of BAMs to LPS (1 or 100 ng/ml) (n = 129 cells) and the response to 100 ng of LPS per ml in nominally Ca2+-free HBSS (n = 62 cells). Note that there is no significant difference in the responses to the two concentrations of LPS. However, the response in nominally Ca2+-free HBSS is significantly attenuated. The asterisk denotes statistical significance (P < 0.05).
FIG. 5
FIG. 5
Integrated [Ca2+]i response of BAMs to LPS in the presence or absence of various inhibitors. The integrated [Ca2+]i response to 1 ng of LPS per ml plus 5% FBS is not affected by prior exposure to pertussis toxin (PTX) (n = 101 cells) or ETYA (n = 30 cells). However, preexposure to U73122 (n = 89 cells) or herbimycin A (Her A) (n = 93 cells) inhibits the responses to LPS significantly (P < 0.05). The period of integration is the actual duration of the response. An asterisk denotes statistical significance (P < 0.05).
FIG. 6
FIG. 6
Representative traces showing the effects of pertussis toxin, MAFP, ETYA, and U73122 on Lkt-induced elevation of [Ca2+]i in BAMs. (A) In BAMs treated with 200 ng of pertussis toxin per ml for 18 h, the [Ca2+]i responses to 1 and 5 U of Lkt per ml are blocked, while the response to 50 U of Lkt per ml is attenuated (n = 71 cells). (B) In BAMs exposed to 2 μM MAFP, the [Ca2+]i elevation to all concentrations of Lkt is blocked (n = 51 cells). The [Ca2+]i response to 50 U of Lkt per ml is only partially restored on washing the cells with HBSS to remove the inhibitor. (C) Exposure to 2 μM U73122 blocks the elevation of [Ca2+]i to all Lkt concentrations (n = 92 cells). The [Ca2+]i response to 50 U of Lkt per ml is only partially restored on washing the cells with HBSS to remove the inhibitor. (D) Exposure to 10 μM ETYA blocks the [Ca2+]i elevation in response to 1 and 5 U of Lkt per ml and attenuates the response to 50 U of Lkt per ml (n = 56 cells).
FIG. 7
FIG. 7
Integrated [Ca2+]i responses of BAMs to 1, 5, and 50 U of Lkt per ml in the presence or absence of the various inhibitors. The responses to all three concentrations of Lkt are significantly inhibited by nifedipine (NFD), pertussis toxin (PTX), the PLA2 inhibitor MAFP, the arachidonic acid analog ETYA, and the PLC inhibitor U73122.
FIG. 8
FIG. 8
Proposed model for Ca2+ signaling in response to P. haemolytica-derived Lkt and LPS in BAMs. The LPS-LBP complex interacts with CD14, resulting in the release of intracellular Ca2+ from the endoplasmic reticulum. This pathway does not involve activation of pertussis toxin-sensitive G proteins but requires activation of protein tyrosine kinase (PTK), since it is inhibited by herbimycin A. Modulation of LPS-induced [Ca2+]i elevation in BAMs by PLC inhibition suggests the involvement of IP3-induced Ca2+ release from the endoplasmic reticulum. Lkt elevates [Ca2+]i through G-protein-coupled activation of Ca2+ influx via L-type channels. This G protein is coupled to PLA2 and PLC. Arachidonic acid (AA) derived from PLA2 activation gates the Ca2+ channels. PLC activation by Lkt may result in AA formation through the conversion of DAG by DAG lipase and/or by regulation of phospholipase activity by PKC, which is activated by DAG.

Similar articles

Cited by

References

    1. Ambs P, Fitzke E, Dieter P. AA-release is under control of PLA2 and DAG lipase in rat liver macrophages. Adv Prostaglandin Thromboxane Leukotriene Res. 1995;23:81–83. - PubMed
    1. Bokoch G M, Reed P W. Evidence for inhibition of leukotriene A4 synthesis by 5,8,11,14-eicosatetraynoic acid in guinea pig polymorphonuclear leukocytes. J Biol Chem. 1981;256:4156–4159. - PubMed
    1. Chandra Sekar M, Hokin L E. The role of phosphoinositides in signal transduction. J Membr Biol. 1986;89:193–210. - PubMed
    1. Chang Z L, Novotney M, Suzuki T. Phospholipase C and A2 in tumoricidal activation of murine macrophage-like cell lines. FASEB J. 1990;4:A1753.
    1. Chen T Y, Lei M G, Suzuki T, Morrison D C. Lipopolysaccharide receptors and signal transduction pathways in mononuclear phagocytes. Curr Top Microbiol Immunol. 1992;181:169–188. - PubMed

Publication types

MeSH terms

LinkOut - more resources