

An analysis of philanthotoxin block for recombinant rat GluR6(Q) glutamate receptor channels
- PMID: 9596788
- PMCID: PMC2230986
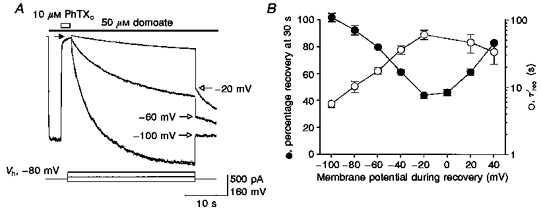
- DOI: 10.1111/j.1469-7793.1998.635bm.x
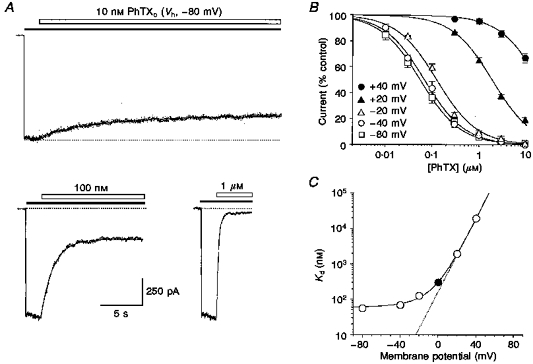
An analysis of philanthotoxin block for recombinant rat GluR6(Q) glutamate receptor channels
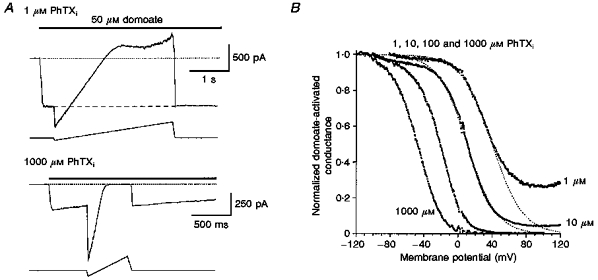
Abstract
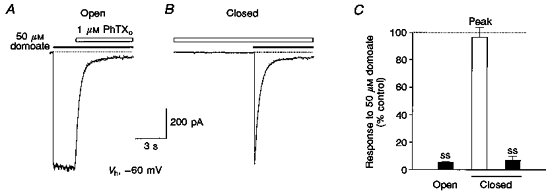
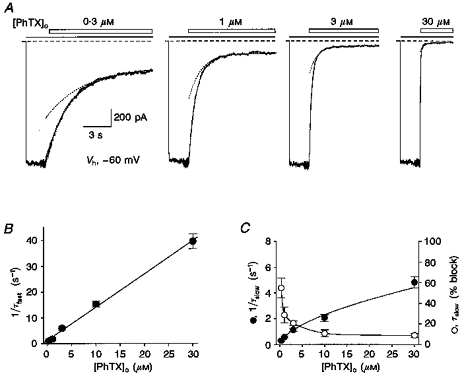
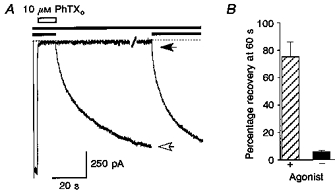
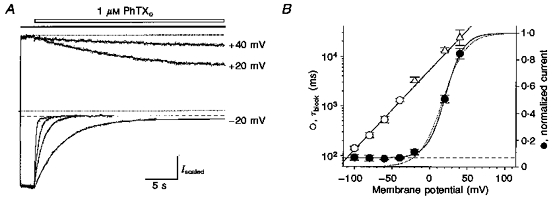
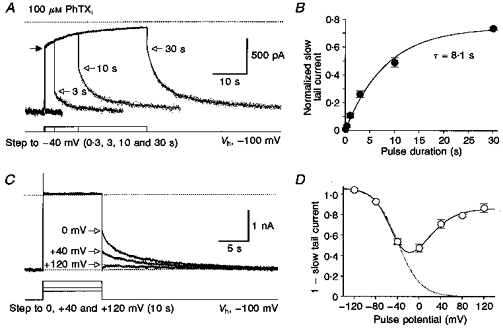
1. The action of philanthotoxin 343 (PhTX) on rat homomeric GluR6(Q) recombinant glutamate receptor channels was analysed using concentration-jump techniques and outside-out patches from HEK 293 cells. Both onset and recovery from block by external PhTX were dependent on the presence of agonist, indicating that channels must open for PhTX to bind and that channel closure can trap PhTX. 2. Block by external PhTX developed with double-exponential kinetics. The rate of onset of the fast component of block showed an exponential increase per 27 mV hyperpolarization over the range -40 to -100 mV. The rate of onset of the slow component of block showed a non-linear concentration dependence indicating a rate-limiting step in the blocking mechanism. 3. The extent of block by 1 microM external PhTX was maximal at -40 mV and did not increase with further hyperpolarization; the rate of recovery from block by external PhTX increased 6-fold on hyperpolarization from -40 to -100 mV suggesting that PhTX permeates at negative membrane potentials. 4. Apparent Kd values for block by external PhTX estimated from dose-inhibition experiments decreased 300-fold on hyperpolarization from +40 mV (Kd, 19.6 microM) to -40 mV (Kd, 69 nM); there was little further increase in affinity with hyperpolarization to -80 mV (Kd, 56 nM), consistent with permeation of PhTX at negative membrane potentials. 5. Block by internal PhTX showed complex kinetics and voltage dependence. Analysis with voltage ramps from -120 to +120 mV indicated a Kd at 0 mV of 20 microM, decreasing e-fold per 16 mV depolarization. However, at +90 mV the extent of block by 1 and 10 microM internal PhTX (73 % and 95 %, respectively) reached a maximum and did not increase with further depolarization. 6. Voltage-jump analysis of block by 100 microM internal PhTX revealed partial trapping. With 100 ms jumps from -100 to -40 mV, onset and recovery from block were complete within 5 ms. With jumps of longer duration the extent of block increased, with a time constant of 8.1 s, reaching 84 % at 30 s. On repolarization to -100 mV, recovery from block showed fast and slow components. 7. The amplitude of the slow component of block by internal PhTX showed a biphasic voltage dependence, first increasing then decreasing with progressive depolarization. Maximum block was obtained at 0 mV. 8. Our results suggest that PhTX acts as an open channel blocker; however, provided that the toxin remains bound to the channel, an allosteric mechanism destabilizes the open state, inducing channel closing and trapping PhTX. Strong depolarization for internal PhTX, or strong hyperpolarization for external PhTX, forces the toxin to permeate before it triggers entry into closed blocked states.
Figures
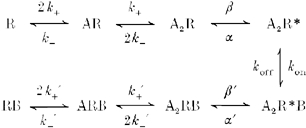
References
-
- Anis N, Sherby S, Goodnow R, Jr, Niwa M, Konno K, Kallimopoulos T, Bukownik R, Nakanishi K, Usherwood P, Eldefrawi A, Eldefrawi M. Structure-activity relationships of philanthotoxin analogs and polyamines on N-methyl-D-aspartate and nicotinic acetylcholine receptors. Journal of Pharmacology and Experimental Therapeutics. 1990;254:764–773. - PubMed
-
- Blanpied TA, Boeckman FA, Aizenman E, Johnson JW. Trapping channel block of NMDA-activated responses by amantadine and memantine. Journal of Neurophysiology. 1997;77:309–323. - PubMed
-
- Blaschke M, Keller BU, Rivosecchi R, Hollmann M, Heinemann S, Konnerth A. A single amino acid determines the subunit-specific spider toxin block of alpha-amino-3-hydroxy-5-methylisoxazole-4-propionate/kainate receptor channels. Proceedings of the National Academy of Sciences of the USA. 1993;90:6528–6532. - PMC - PubMed
MeSH terms
Substances
LinkOut - more resources
Full Text Sources
Miscellaneous