

A slow calcium-dependent component of charge movement in Rana temporaria cut twitch fibres
- PMID: 9596806
- PMCID: PMC2231000
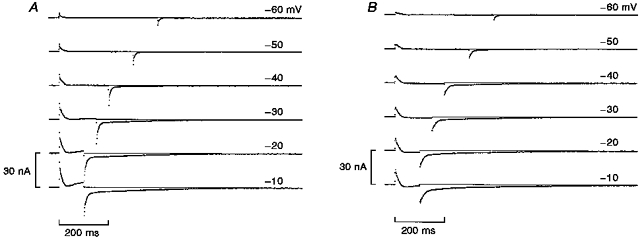
- DOI: 10.1111/j.1469-7793.1998.869bm.x
A slow calcium-dependent component of charge movement in Rana temporaria cut twitch fibres
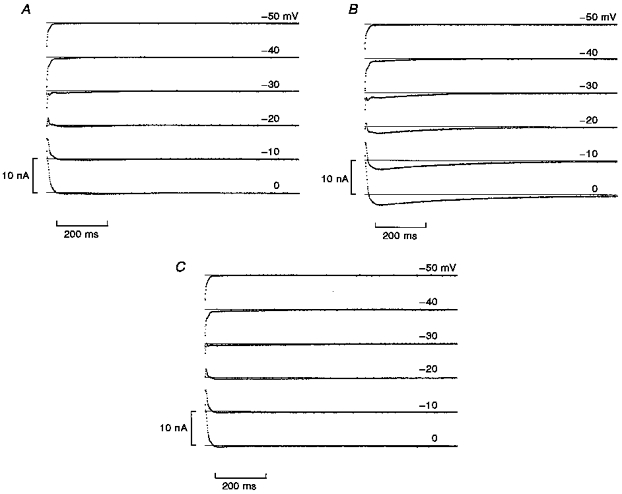
Abstract
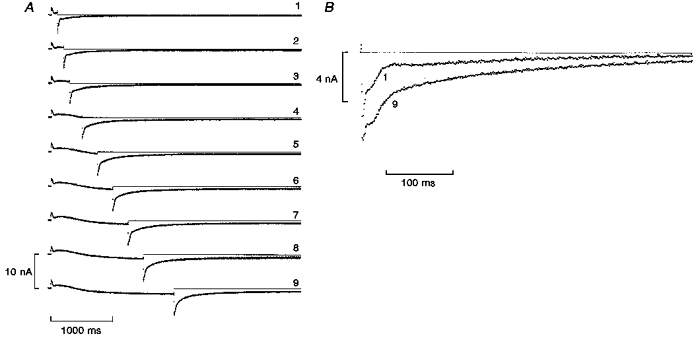
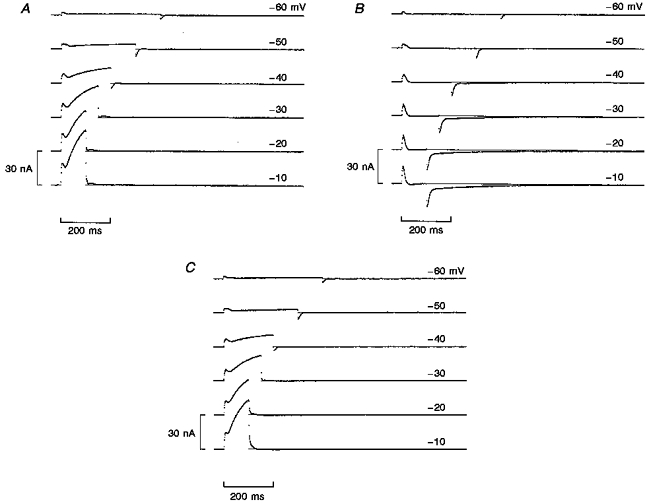
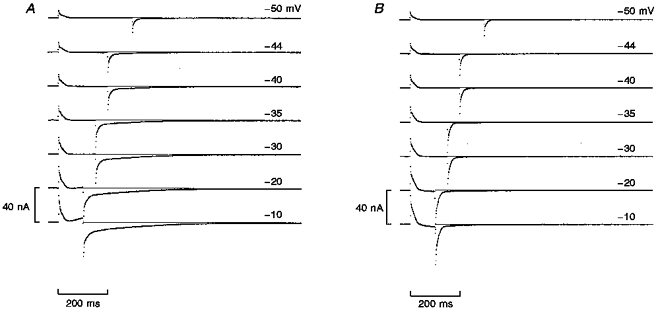
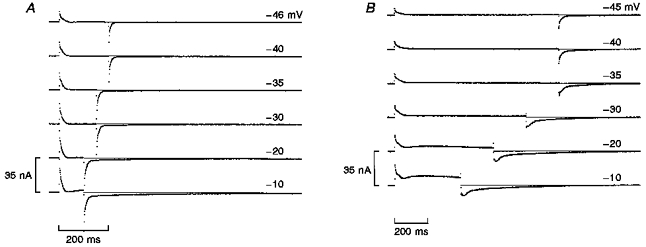
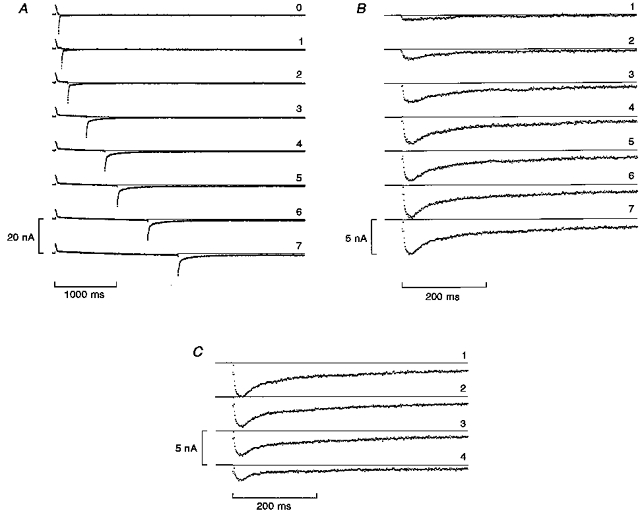
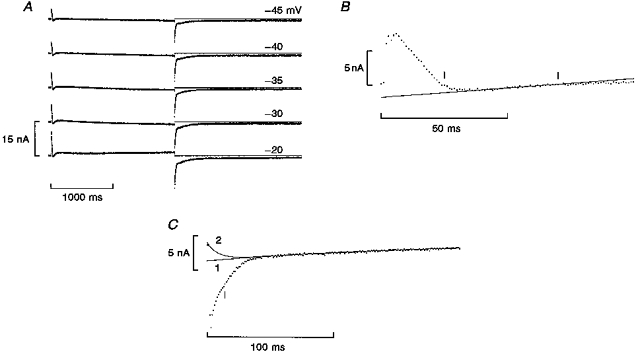
1. Charge movement was studied in highly stretched frog cut twitch fibres in a double Vaseline-gap voltage-clamp chamber, with the internal solution containing either 0.1 mM EGTA or 20 mM EGTA plus 1. 8 mM total Ca2+. 2. Fibres were stimulated with TEST pulses lasting 100-400 ms. Replacement of the external Cl- with an 'impermeant' anion, such as SO42-, CH3SO3-, gluconate or glutamate, greatly reduced the calcium-dependent Cl- current in the ON segment and generated a slowly decaying inward OFF current in charge movement traces. 3. Application of 20 mM EGTA to the internal solution abolished the slow inward OFF current, implying that the activation of the current depended on the presence of Ca2+ in the myoplasm. The possibility that the slow inward OFF current was carried by cations flowing inwards or anions flowing outwards was studied and determined to be unlikely. 4. During a long (2000 ms) TEST pulse, a slowly decaying ON current was also observed. When the slow ON and OFF currents were included as parts of the total charge movement, ON-OFF charge equality was preserved. This slow capacitive current is named Idelta. 5. When Cl- was the major anion in the external solution, the OFF Idelta was mostly cancelled by a slow outward current carried by the inflow of Cl-. 6. The OFF Idelta component showed a rising phase. The average values of the rising time constants in CH3SO3- and SO42- were similar and about half of that in gluconate. 7. The OFF Idelta component in CH3SO3- had a larger magnitude and longer time course than that in SO42-. The maximum amount of Qdelta in CH3SO3- was about three times as much as that in SO42-, whereas the voltage dependence of Qdelta was similar in the two solutions. 8. Since the existence of Qdelta depends on the presence of Ca2+ in the myoplasm, it is speculated that Qdelta could be a function of intracellular calcium release.
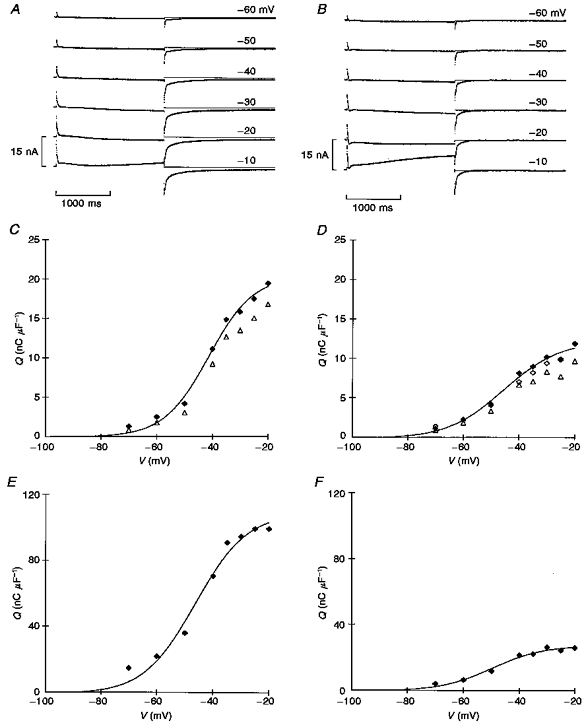
Figures
Similar articles
-
Origin of delayed outward ionic current in charge movement traces from frog skeletal muscle.J Physiol. 1994 Aug 15;479 ( Pt 1)(Pt 1):109-25. doi: 10.1113/jphysiol.1994.sp020281. J Physiol. 1994. PMID: 7527460 Free PMC article.
-
Effect of sarcoplasmic reticulum (SR) calcium content on SR calcium release elicited by small voltage-clamp depolarizations in frog cut skeletal muscle fibers equilibrated with 20 mM EGTA.J Gen Physiol. 1998 Aug;112(2):161-79. doi: 10.1085/jgp.112.2.161. J Gen Physiol. 1998. PMID: 9689025 Free PMC article.
-
Charge movement in cut twitch fibres of Rana temporaria containing 0.1 mM EGTA.J Physiol. 1997 Sep 15;503 ( Pt 3)(Pt 3):563-70. doi: 10.1111/j.1469-7793.1997.563bg.x. J Physiol. 1997. PMID: 9379411 Free PMC article.
-
Calcium release in frog cut twitch fibers exposed to different ionic environments under voltage clamp.Biophys J. 1999 Oct;77(4):2123-36. doi: 10.1016/S0006-3495(99)77053-0. Biophys J. 1999. PMID: 10512832 Free PMC article.
-
A damped oscillation in the intramembranous charge movement and calcium release flux of frog skeletal muscle fibers.J Gen Physiol. 1994 Sep;104(3):449-76. doi: 10.1085/jgp.104.3.449. J Gen Physiol. 1994. PMID: 7528782 Free PMC article.
Cited by
-
Association of the Igamma and Idelta charge movement with calcium release in frog skeletal muscle.Biophys J. 2005 Feb;88(2):1030-45. doi: 10.1529/biophysj.104.048215. Epub 2004 Nov 8. Biophys J. 2005. PMID: 15533918 Free PMC article.
References
-
- Adrian RH, Peres AR. A gating signal for the potassium channel? Nature. 1977;267:800–804. - PubMed
Publication types
MeSH terms
Substances
Grants and funding
LinkOut - more resources
Full Text Sources
Miscellaneous