

Incomplete rematching of nerve and muscle properties in motor units after extensive nerve injuries in cat hindlimb muscle
- PMID: 9596809
- PMCID: PMC2231005
- DOI: 10.1111/j.1469-7793.1998.909bm.x
Incomplete rematching of nerve and muscle properties in motor units after extensive nerve injuries in cat hindlimb muscle
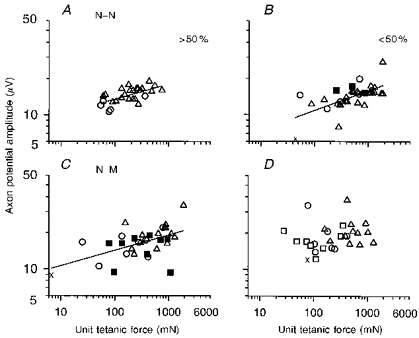
Abstract
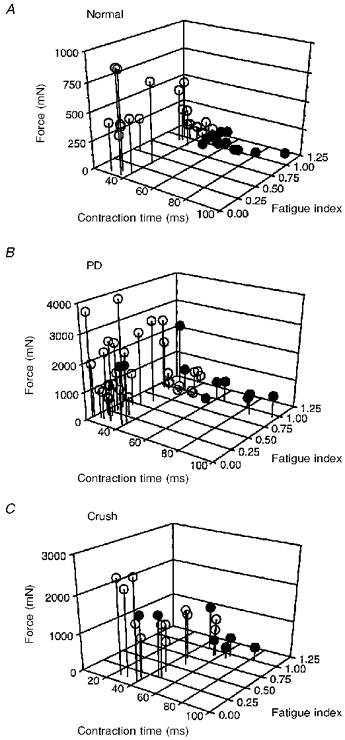
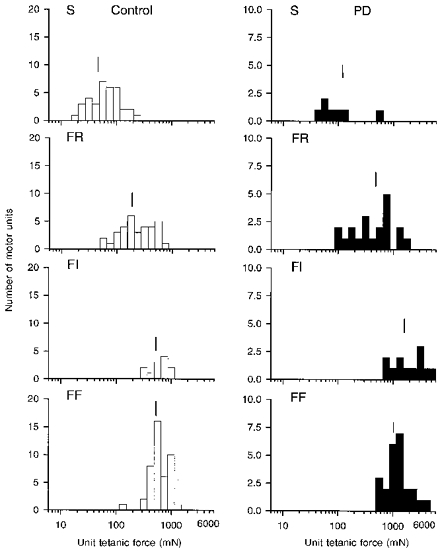
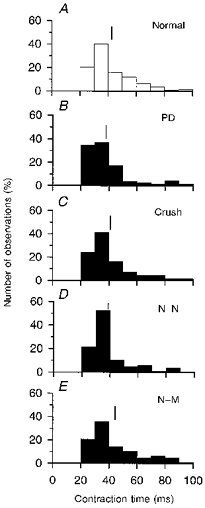
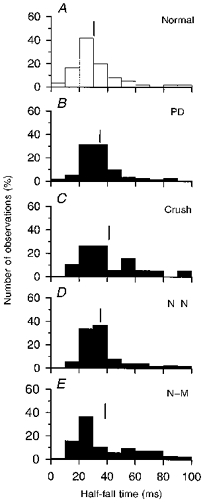
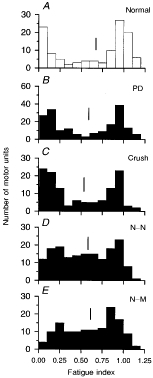
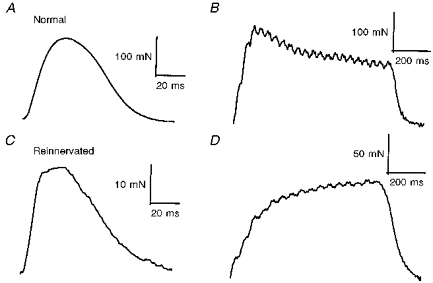
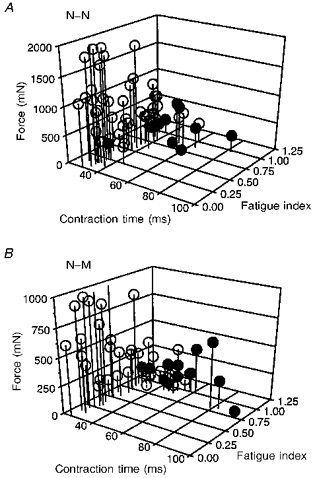
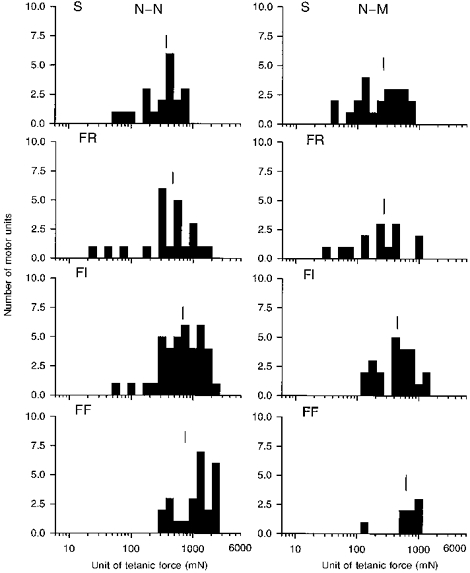
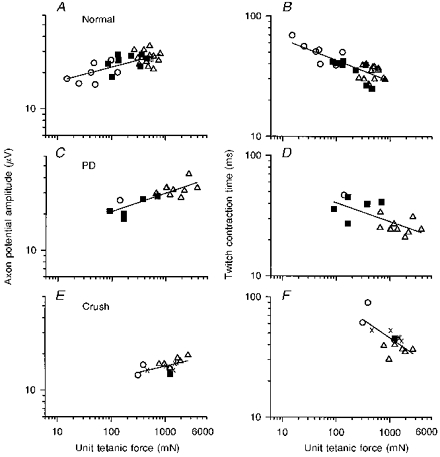
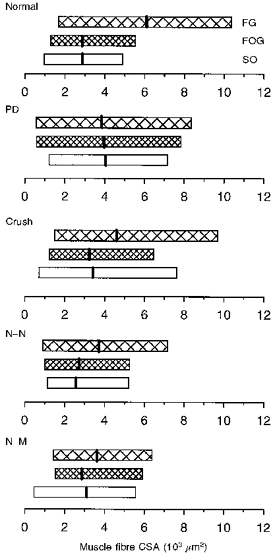
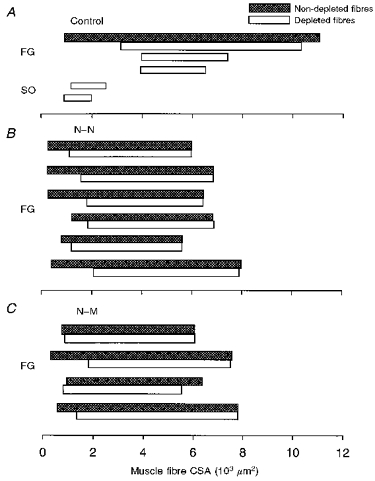
1. Motor units were characterized in partially denervated or completely denervated and reinnervated cat medial gastrocnemius (MG) muscles where the number of innervating motor axons was severely reduced to determine (1) to what extent the nerve and muscle properties are rematched in enlarged motor units, (2) whether the normal size relationships between axon size, unit tetanic force and contractile speed are re-established, and (3) whether the type of nerve injury and/or repair affects the re-establishment of nerve and muscle properties. 2. Single MG units were sampled in (1) partially denervated muscles and in reinnervated muscles after either (2) crushing or (3) transecting the nerve and suturing its proximal end to either the distal nerve stump (N-N), or (4) directly to the muscle fascia (N-M). 3. The majority (75-88 %) of motor units in all muscles were classified as S (slow), FR (fast fatigue resistant), FI (fast fatigue intermediate) and FF (fast fatigable). However, there was an increased number of FI and unclassifiable motor units compared to normal. These results suggest that motor unit properties are not entirely regulated by the reinnervating motoneurone. 4. Despite more overlap in the range of unit force between different motor unit types the tetanic force of each type increased in all muscles when reinnervated by few (< 50 %) motor axons. This increase in unit force was due to an expansion in motor unit innervation ratio. 5. The normal relationships between axon size, unit tetanic force, and contractile speed were re-established in all muscles except when reinnervated by < 50 % of their normal complement of motor units after N-M suture. This lack of correlation was due to the reduced fast glycolytic (FG) fibre size and the proportionately greater increase in force of the S units. 6. After reinnervation the ranges in fibre cross-sectional area within single FF units were very similar to those found within the entire FG fibre population. 7. These results show that when few axons make functional connections in partially denervated or reinnervated muscles the normal relationships between axon size and motor unit contractile properties are re-established provided the nerves regenerate within the distal nerve sheath. This rematching of motoneurone size and motor unit contractile properties occurs primarily because the size of the motor axon governs the number of muscle fibres it supplies.
Figures
References
-
- Bodine SC, Roy RR, Eldred E, Edgerton VR. Maximal force as a function of anatomical features of motor units in the cat tibialis anterior. Journal of Neurophysiology. 1987;57:1730–1745. - PubMed
-
- Boyd IA, Davey MR. Composition of Peripheral Nerves. London: Livingston; 1968.
-
- Brooke MH, Kaiser KK. Three ‘myosin adenosine triphosphatase’ systems: the nature of their pH lability and sulfhydryl dependence. Journal of Histochemistry and Cytochemistry. 1970;19:670–672. - PubMed
Publication types
MeSH terms
LinkOut - more resources
Full Text Sources
Medical
Miscellaneous