Review
. 1998 May 26;95(11):5849-56.
doi: 10.1073/pnas.95.11.5849.

Measuring genome evolution

Affiliations
Review

Measuring genome evolution

M A Huynen et al. Proc Natl Acad Sci U S A. .

Abstract

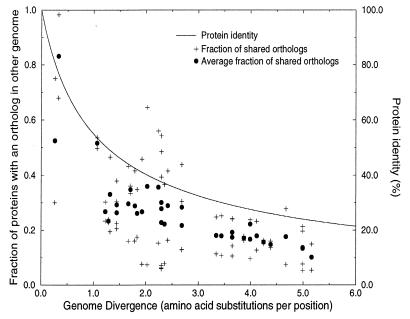
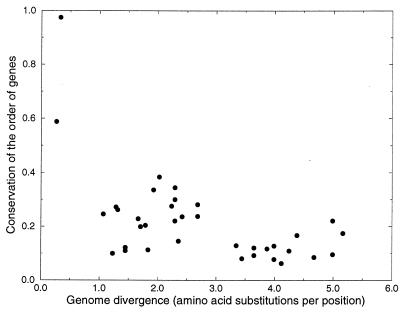
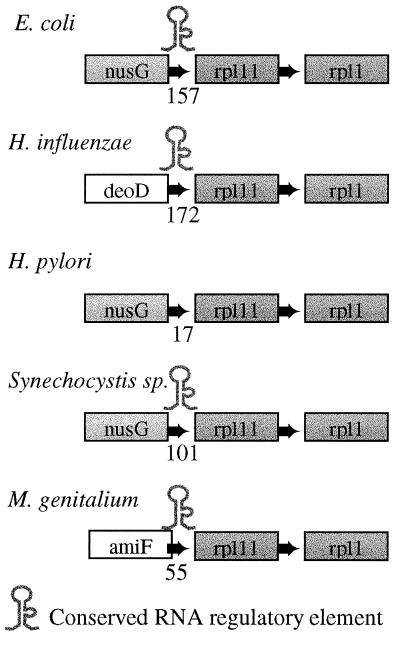
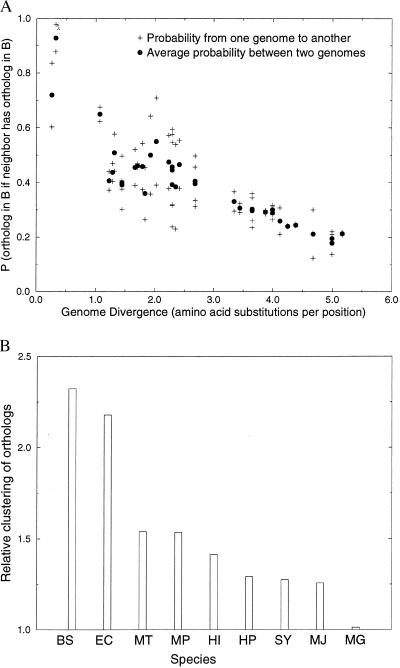
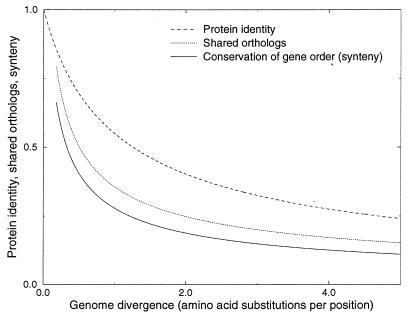
The determination of complete genome sequences provides us with an opportunity to describe and analyze evolution at the comprehensive level of genomes. Here we compare nine genomes with respect to their protein coding genes at two levels: (i) we compare genomes as "bags of genes" and measure the fraction of orthologs shared between genomes and (ii) we quantify correlations between genes with respect to their relative positions in genomes. Distances between the genomes are related to their divergence times, measured as the number of amino acid substitutions per site in a set of 34 orthologous genes that are shared among all the genomes compared. We establish a hierarchy of rates at which genomes have changed during evolution. Protein sequence identity is the most conserved, followed by the complement of genes within the genome. Next is the degree of conservation of the order of genes, whereas gene regulation appears to evolve at the highest rate. Finally, we show that some genomes are more highly organized than others: they show a higher degree of the clustering of genes that have orthologs in other genomes.


Figures

Figure 1
Figure 1
An example of complexities in assigning orthology to multidomain proteins. The M. thermoautotrophicum genes MTH444 (a sensory transduction histidine kinase) and MTH445 (a sensory transduction regulatory protein) are orthologs of the Synechocystis sequences slr0473 (phytochrome; ref. 41) and slr0474, respectively (the gene nomenclature is from the GenBank files of complete genomes, the first letters of gene names generally represent the initials of the genomes). The arguments for orthology are: (i) The genes have a 34.8% and a 40.2% identity to each other, which is significantly higher than either of them has to other sequences in the other’s genome. (ii) They are neighboring genes in both genomes. (iii) Both MTH444 and slr0473 have the highest level of identity to a single sequence from a third species Archeoglobus fulgidus (42), AF1483, the same is true for MTH445 and slr0474 with respect to AF1472. Interestingly, the level of identity of the Synechocystis sequences slr0473 and slr0474 is significantly higher to the M. thermoautotrophicum and A. fulgidus sequences than it is to any of the sequences in the Bacteria, including sequences in Synechocystis itself. The reverse is even more dramatic: MTH445, AF1472, and MTH444, AF1483 are more identical, not only to their Synechocystis orthologs, but also to 27 respectively 28 other sequences in Synechocystis than they are to sequences in their own genomes. These 27 (28) sequences are paralogs of slr0473 (slr0474). The similarity between MTH444 and AF1483 is slightly lower than that between AF1483 and slr0473, whereas the similarity between AF1472 and MTH444 is significantly higher than that of either of them to slr0473. Neighbor-joining clusterings of the histidine kinase orthologs together with their most similar sequences from the three genomes (A) illustrates the most likely evolutionary scenario: a horizontal transfer of the genes in the branch that has led to Synechocystis, to the branch leading to M. thermoautotrophicum and A. fulgidus. Given the relative similarities of the proteins, this event occurred after a major amplification of the histidine kinase family in Synechocystis and not long before the split of the branches that led to M. thermoautotrophicum and A. fulgidus. The fact that none of the proteins have a detectable homolog in M. jannaschii, which branched off in the Archaea not long before the branching of A. fulgidus and M. thermoautotrophicum, supports this hypothesis. The only inconsistency is the fact that in the clustering of the kinases, AF1483 and slr0473 are slightly more similar to each other than either is to MTH444. (B) Domain architecture of slr0473, AF1483, and MTH444. The genes slr0473 and AF1483 are multidomain proteins, carrying GAF (43) domains and PAS (44, 45) motifs at their N terminus. The PAC motif (44, 45) could be detected only in AF1483. The GAF domain and PAS and PAC motifs are absent in MTH444, and have been replaced by three transmembrane regions (see ref. 11). All three genes possess a histidine kinase domain (HisKc) at their C terminus; 3′ to the slr0473 and MTH444 genes are the regulatory response genes slr0474 and MTH445. The distances between the reading frames are short: 15 nucleotides in Synechocystis and the reading frames overlap in M. thermoautotrophicum. In A. fulgidus the spatial association between these genes is absent. The absence of the GAF and PAS domains in MTH444 might have caused different selective constraints in MTH444 than in slr0473 and AF1483, and thus increased its rate of evolution, thereby reducing its similarity to its A. fulgidus and Synechocystis orthologs at a relatively high rate. The GAF, PAC, and PAS domains were predicted by using the smart system (ref. ; http://www.bork.embl-heidelberg.de/Modules/sinput.shtml).
Figure 2
Figure 2
The relationship between genome similarity, measured as the fraction of shared orthologs, and time, measured as the number of amino acid substitutions per protein per position in a set of 34 orthologs. + shows the fraction of sequences in a genome A that has an ortholog in another genome B, and vice versa. This measure is asymmetric, a relatively small genome like H. influenzae is more similar to a large one like E. coli than E. coli is similar to H. influenzae. • shows the average of the two asymmetric similarities. Here we use a minimal definition of orthology: sequences that between two genomes have the highest, significant (E < 0.01) level of pairwise identity, that covers at least 60% of one of the proteins are regarded as orthologs. Sequences were compared with the Smith–Waterman algorithm (47), using a parallel Bioccellerator computer. The relationship between sequence identity and the number of amino acid substitutions per position as calculated with Grishin’s equation (25) is given for comparison. If one assumes that the divergence time between the Archaea and Bacteria is 3.5 billion years (23), the unit of one amino acid substitution corresponds to about 875 million years. In this estimate of divergence time the Mycoplasmas and H. pylori are not included, because they have a relatively high rate of evolution. The highest six divergence times correspond to the comparisons of the Mycoplasmas and H. pylori with the Archaea. As is clear from the figure, the fraction of shared orthologs between genomes decreases more rapidly in evolution than does the protein identity. Note that the base level of shared orthologs at which the figure saturates consists only partly of a set of sequences that are shared by all the genomes compared. For example, there are 15 orthologous pairs shared between M. genitalium and M. thermoautotrophicum of which none of the genes has a homolog at the E < 0.01 level in M. jannaschii. Of this set, the ones with the highest level of protein identity are: DnaK and DnaJ (MG305 and MG019), heat shock proteins with 51% and 50% identity, respectively to their M. thermoautotrophicum ortholog, deoxyribose-phosphate aldolase (MG050) with 40% identity, a pyrophosphatase (MG351) with 40.5% identity, and a transcriptional regulator (MG448) with 45% identity. Genes that are shared by M. genitalium and M. jannaschii but that are absent in M. thermoautotrophicum, include proteins from the glycolysis like pyruvate kinase (MG216) with 29.1% identity and glucose-6-phosphate isomerase (MG111) with 27% protein identity.
Figure 3
Figure 3
Conservation of the order of genes within the genome. Shown are the number of genes that are orthologs in both genomes, and that have at least one neighboring gene that is the same ortholog in both genomes, divided by the total number of shared orthologs between the genomes. The x axis shows the divergence of the genomes measured in amino acid substitutions per position. The figure clearly indicates the rapid differentiation of gene order in evolution. Gene order between genomes is less conserved than the fraction of shared orthologs (compare with Fig. 2).
Figure 4
Figure 4
Conservation of an RNA secondary structure at the 5′ end of rpl11 operon in Bacterial genomes. The order of the ribosomal protein genes rpl11 and rpl1 is conserved in all of the Bacteria analyzed. The gene nusG is a transcription antitermination factor, Amif is an oligopeptide transport ATP-binding protein, and deoD codes for a purine-nucleoside phosphorylase. The number between the first and second gene indicates the length of the intergenic region. Surprisingly, the secondary structure is absent from H. pylori, even though it shares the presence of nusG 5′ of rpl11 with E. coli, whereas H. influenzae lacks NusG at this position. Notice furthermore that the element has been deleted in H. pylori rather than lost because of point mutations, as there is no space left between nusG and rpl11 in H. pylori. The element is also present in M. pneumoniae, but is absent from the Archaea. The element is part of the 5′ leader of the L11 mRNA sequence and is likely to function in the autoregulation of the rpl11 operon (ref. and Y. Diaz-Lazcoz, M.A.H. and P.B., unpublished data).
Figure 5
Figure 5
(A) The probability that a gene in genome A has an ortholog in another genome B if a neighboring gene in A has an ortholog in genome B. The probabilities clearly increase, as compared with the average probability of having an ortholog in another genome (compare Fig. 2). (B) The relative degree of clustering of genes in one genome (A) that have an ortholog in another genome (B). The analysis includes only genes that are clustered (“neighbors”) in genome A, but not in B (and vice versa). Shown is the ratio of the number of genes in A that have an ortholog in B and have at least one neighboring gene that also has an ortholog in B, divided by the expected number. The expected number of genes that are neighbors in a genome, given a random distribution, is calculated as follows: Given X genes that are randomly distributed over a genome with Y loci, the probability that a gene from X has no neighboring genes from X (it lies isolated) is the probability that it has no left-neighbor from X nor a right-neighbor from X: P0 = [(YX)/(Y − 1)]* [(YX − 1)/(Y − 2)]. The expected number of genes from X with at least one neighbor from X: P1,2 = 1 − P0. The fraction of genes in genome A with at least one neighbor that also has an ortholog in genome B is thus divided by P1,2 to get to the relative clustering of the genes in genome A. The relative clustering is averaged over the genome comparisons of one genome versus the eight other genomes. The names of the species have been abbreviated to the first letters of their genus and species name. All genomes, except M. genitalium show a more than expected clustering of genes. Given its small size, M. genitalium has relatively little room to cluster the genes that have an ortholog in another genome above the expected level of clustering: i.e., most of the genes that have an ortholog in another genome are expected to be neighbors in M. genitalium. The correlation with genome size is not perfect however. For example, Synechocystis, which has a relatively large genome, shows relatively little genome organization.
Figure 6
Figure 6
Relative rates of genome evolution. The curves were fitted from the fraction of shared orthologs (Fig. 2) and the conservation of the order of genes (Fig. 3), the curve that shows the relationship between protein identity and the number of amino acid substitutions per position according to Grishin’s equation (Fig. 2), was added for comparison. Intergenic regions are even less conserved than the order of genes. Nonorthologous gene displacement indicates that metabolism is more conserved than the fraction of shared orthologous genes.

References

    1. Blattner F E, III, Bloch C A, Perna N T, Burland V, Riley M, Collado-Vides J, Glasner J D, Rode C K, Mayhew G F. Science. 1997;277:1453–1462. - PubMed
    1. Karlin S, Mrazek J, Campbell A. J Bacteriol. 1997;179:3899–3913. - PMC - PubMed
    1. Hood D W, Deadman M E, Jennings M P, Bisercic M, Fleishmann R D, Venter J C, Moxon E R. Proc Natl Acad Sci USA. 1996;93:11121–11125. - PMC - PubMed
    1. Huynen, M. A. & van Nimwegen, E. (1998) Mol. Biol. Evol., in press. - PubMed
    1. Gelfand M S, Koonin E V. Nucleic Acids Res. 1997;25:2430–2439. - PMC - PubMed

Publication types

LinkOut - more resources