

A statistical mechanical model for beta-hairpin kinetics
- PMID: 9600886
- PMCID: PMC34489
- DOI: 10.1073/pnas.95.11.5872
A statistical mechanical model for beta-hairpin kinetics
Abstract
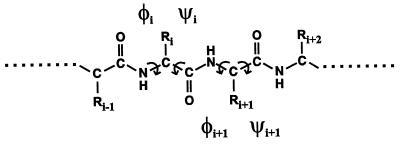
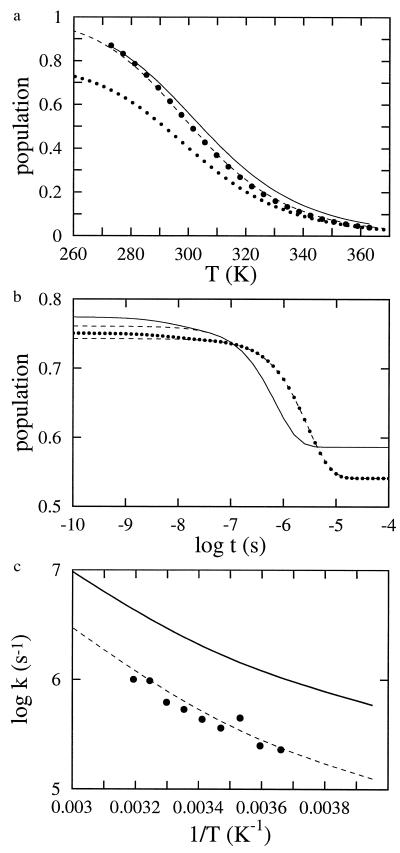
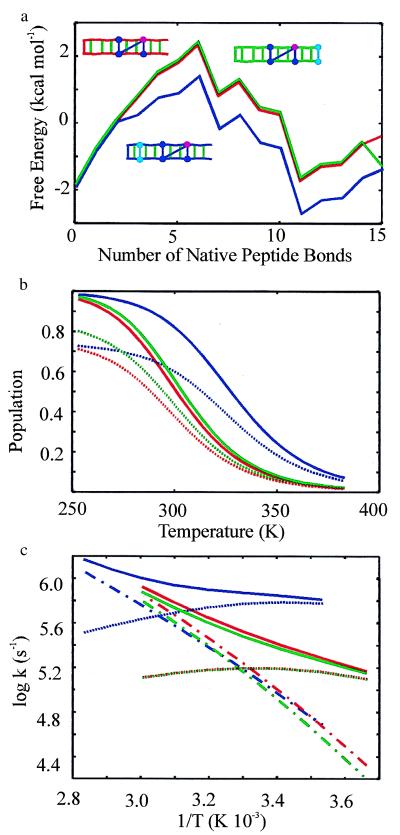
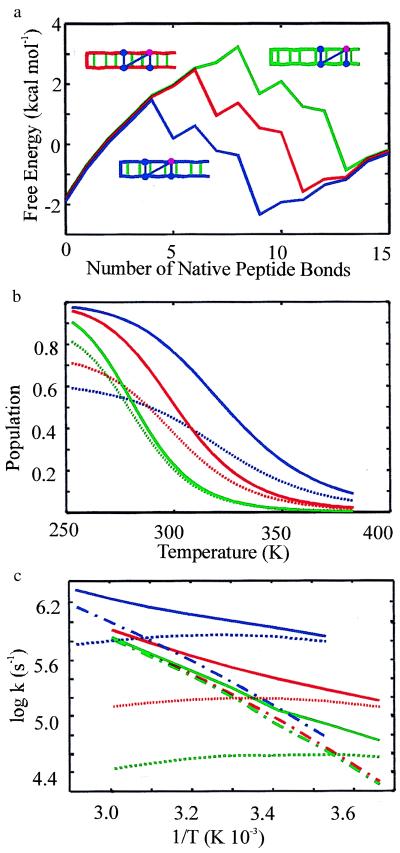
Understanding the mechanism of protein secondary structure formation is an essential part of the protein-folding puzzle. Here, we describe a simple statistical mechanical model for the formation of a beta-hairpin, the minimal structural element of the antiparallel beta-pleated sheet. The model accurately describes the thermodynamic and kinetic behavior of a 16-residue, beta-hairpin-forming peptide, successfully explaining its two-state behavior and apparent negative activation energy for folding. The model classifies structures according to their backbone conformation, defined by 15 pairs of dihedral angles, and is further simplified by considering only the 120 structures with contiguous stretches of native pairs of backbone dihedral angles. This single sequence approximation is tested by comparison with a more complete model that includes the 2(15) possible conformations and 15 x 2(15) possible kinetic transitions. Finally, we use the model to predict the equilibrium unfolding curves and kinetics for several variants of the beta-hairpin peptide.
Figures


Similar articles
-
Two state behavior in a solvable model of beta-hairpin folding.Phys Rev Lett. 2000 Apr 10;84(15):3490-3. doi: 10.1103/PhysRevLett.84.3490. Phys Rev Lett. 2000. PMID: 11019122
-
Folding dynamics and mechanism of beta-hairpin formation.Nature. 1997 Nov 13;390(6656):196-9. doi: 10.1038/36626. Nature. 1997. PMID: 9367160
-
Folding and aggregation kinetics of a beta-hairpin.Biochemistry. 2006 Jun 13;45(23):7023-35. doi: 10.1021/bi052556a. Biochemistry. 2006. PMID: 16752893
-
Understanding the mechanism of beta-sheet folding from a chemical and biological perspective.Biopolymers. 2008;90(6):751-8. doi: 10.1002/bip.21101. Biopolymers. 2008. PMID: 18844292 Review.
-
Formation and stability of beta-hairpin structures in polypeptides.Curr Opin Struct Biol. 1998 Feb;8(1):107-11. doi: 10.1016/s0959-440x(98)80017-1. Curr Opin Struct Biol. 1998. PMID: 9519303 Review.
Cited by
-
Binary and ternary aggregation within tethered protein constructs.Biophys J. 2006 Apr 15;90(8):2930-7. doi: 10.1529/biophysj.105.075846. Epub 2006 Jan 20. Biophys J. 2006. PMID: 16428283 Free PMC article.
-
Residual interactions in unfolded bile acid-binding protein by 19F NMR.Protein Sci. 2011 Feb;20(2):327-35. doi: 10.1002/pro.563. Protein Sci. 2011. PMID: 21280124 Free PMC article.
-
Making connections between ultrafast protein folding kinetics and molecular dynamics simulations.Proc Natl Acad Sci U S A. 2011 Apr 12;108(15):6103-8. doi: 10.1073/pnas.1019552108. Epub 2011 Mar 24. Proc Natl Acad Sci U S A. 2011. PMID: 21441105 Free PMC article.
-
Infrared study of the stability and folding kinetics of a series of β-hairpin peptides with a common NPDG turn.J Phys Chem B. 2011 Dec 29;115(51):15332-8. doi: 10.1021/jp2046867. Epub 2011 Dec 2. J Phys Chem B. 2011. PMID: 22136248 Free PMC article.
-
Understanding beta-hairpin formation.Proc Natl Acad Sci U S A. 1999 Aug 3;96(16):9068-73. doi: 10.1073/pnas.96.16.9068. Proc Natl Acad Sci U S A. 1999. PMID: 10430896 Free PMC article.
References
-
- Anfinsen C B. Science. 1973;181:223–230. - PubMed
-
- Bryngelson J D, Onuchic J N, Socci N D, Wolynes P G. Proteins Struct Funct Genet. 1995;21:167–195. - PubMed
-
- Orland H, Garel T, Thirumalai D T. In: Recent Developments in Theoretical Studies of Proteins. Elber R, editor. Singapore: World Scientific; 1996. pp. 197–268.
MeSH terms
Substances
LinkOut - more resources
Full Text Sources
Other Literature Sources
