. 1998 May 26;95(11):5942-9.
doi: 10.1073/pnas.95.11.5942.

Electrostatic steering and ionic tethering in enzyme-ligand binding: insights from simulations

Affiliations

Electrostatic steering and ionic tethering in enzyme-ligand binding: insights from simulations

R C Wade et al. Proc Natl Acad Sci U S A. .

Abstract

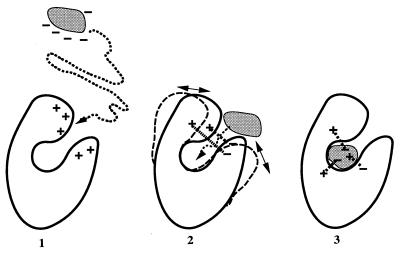
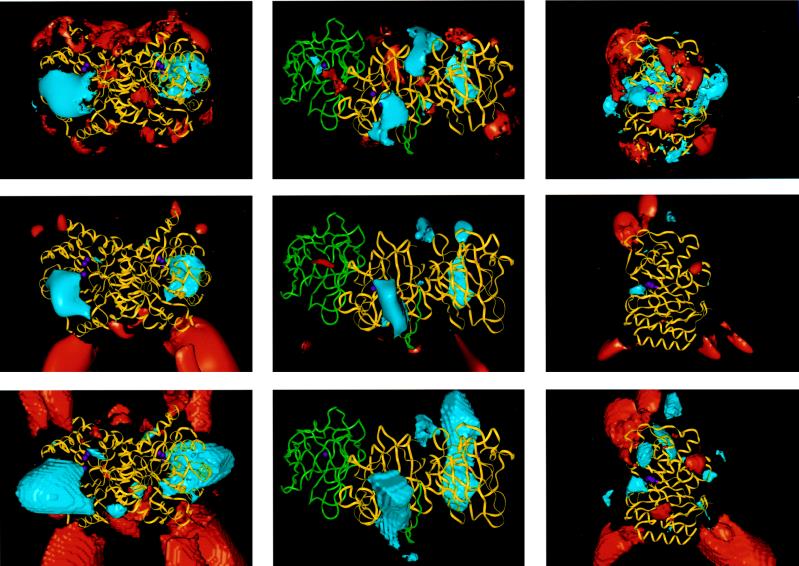
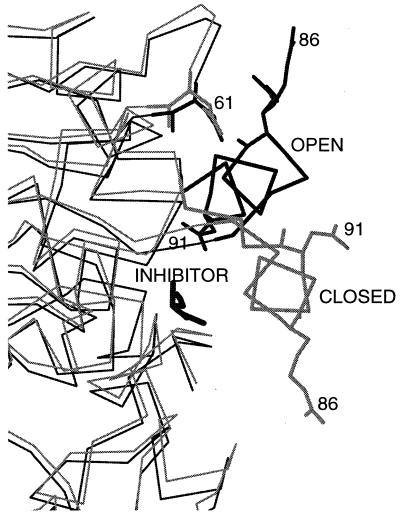
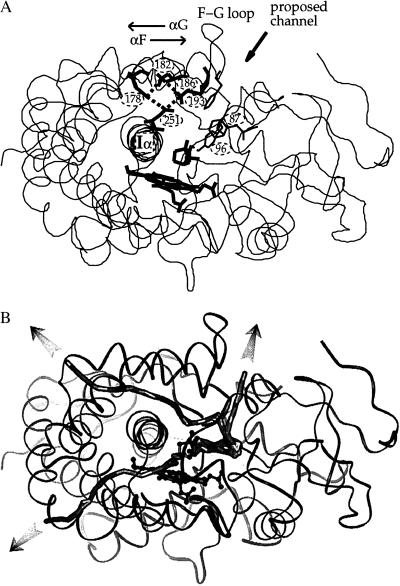
To bind at an enzyme's active site, a ligand must diffuse or be transported to the enzyme's surface, and, if the binding site is buried, the ligand must diffuse through the protein to reach it. Although the driving force for ligand binding is often ascribed to the hydrophobic effect, electrostatic interactions also influence the binding process of both charged and nonpolar ligands. First, electrostatic steering of charged substrates into enzyme active sites is discussed. This is of particular relevance for diffusion-influenced enzymes. By comparing the results of Brownian dynamics simulations and electrostatic potential similarity analysis for triose-phosphate isomerases, superoxide dismutases, and beta-lactamases from different species, we identify the conserved features responsible for the electrostatic substrate-steering fields. The conserved potentials are localized at the active sites and are the primary determinants of the bimolecular association rates. Then we focus on a more subtle effect, which we will refer to as "ionic tethering." We explore, by means of molecular and Brownian dynamics simulations and electrostatic continuum calculations, how salt links can act as tethers between structural elements of an enzyme that undergo conformational change upon substrate binding, and thereby regulate or modulate substrate binding. This is illustrated for the lipase and cytochrome P450 enzymes. Ionic tethering can provide a control mechanism for substrate binding that is sensitive to the electrostatic properties of the enzyme's surroundings even when the substrate is nonpolar.


Figures

Figure 1
Figure 1
Schematic diagram showing how electrostatic interactions can influence the binding of a ligand (shaded) to a protein (outline). Step 1, electrostatic forces and torques can steer the ligand into its binding site on the protein. Step 2, electrostatic interactions such as salt links can affect the protein dynamics necessary for ligand access to binding sites shielded from solvent in “gated” binding. Step 3, electrostatic interactions, particularly salt links and hydrogen bonds, between ligand and protein can contribute to binding affinity and specificity and to the structural binding mode of the complex formed.
Figure 2
Figure 2
Electrostatic potential comparison for variants of TIM (Left), SOD (Center), and BLAC (Right). (Top) Average potential contoured at ±0.4 kcal⋅mol−1⋅e−1 (1 kcal = 4.184 kJ). (Middle) Similarity index with most conserved regions within contours at a level of 0.75 in all cases, except for the red contours in Center, which are at 0.85. (Bottom) Contours enclose regions where the sign of the electrostatic potential is conserved. In all cases, red represents regions of negative potential and blue represents regions of positive potential. Magenta solid spheres represent important active site-atoms: carboxylate oxygens of Glu-165 and amino nitrogen of Lys-13 in TIM, Cu and Zn ions in SOD, and the side chain of the catalytic Ser-70 in BLAC. The proteins are represented by ribbon plots of representative variants: chicken muscle TIM, bovine (yellow) and P. leiognathi (green) SOD, and TEM-1 BLAC. The dimers of all SODs studied except that from P. leiognathi superimpose well on the bovine SOD. Consequently, one monomer of P. leiognathi was superimposed on one monomer of bovine SOD instead of the complete dimer as done for the other SODs. Negative contours are not shown for the sign conservation plot in SOD (Center Bottom) for clarity. The similarity index, SI, is computed at points (i, j, k) around the proteins from the following formula, which is generalized to the comparison of N potentials. φl, l = 1, 2, … , N, from the Hodgkin formula for the comparison of two potentials (59): formula image SI = +1 when the potentials are all identical. SI = −1 when two potentials are opposite (N < 3). For small deviations, Δφn, from the average potential, the decrease in the SI from its maximum (= 1) is proportional to (Δφn)2. This is because the SI can be rewritten as: formula image For example, when SI = 0.85 for four potentials, formula image≈ 0.335. The SI (and the average potential and sign conservation) are computed outside the molecules’ combined van der Waals volume as defined with atomic radii set at twice their normal values.
Figure 3
Figure 3
Part of the α-carbon trace of two crystal structures of the lipase from R. miehei showing the positions of the helical lid in open (black) and closed (gray) forms of the enzyme. In the crystal structure of the open form of the enzyme, an inhibitor is bound in the active site. All non-hydrogen atoms are shown for selected titratable residues (numbered) involved in electrostatic interactions affecting the position of the helical lid. In the open form, Arg-86 in the lid is close to Asp-61.
Figure 4
Figure 4
Ribbon diagram of the crystal structure (51) of cytochrome P450cam with the buried heme and camphor substrate shown in bold. (A) The salt-link tetrad of residues involving Asp-251 is shown in bold. The region where a channel has been proposed, on the basis of crystallographic data (51, 60), to open up to allow ligand access to the active site is indicated. This channel is lined by aromatic residues whose side chains are shown (Tyr-96, Phe-87, and Phe-193). (B) Three representative camphor exit pathways derived by molecular dynamics simulation (54) are shown by thick lines that follow the position of the center of mass of the camphor as it escapes from the active site during the trajectories. The other trajectories simulated are clustered in the vicinity of each of these trajectories.

Similar articles

Cited by

References

    1. Davis M E, Madura J D, Sines J, Luty B A, Allison S A, McCammon J A. Methods Enzymol. 1991;202:473–497. - PubMed
    1. Tan R C, Truong T N, McCammon J A, Sussman J L. Biochemistry. 1993;32:401–403. - PubMed
    1. Wade R C. Biochem Soc Trans. 1996;24:254–259. - PubMed
    1. Madura J D, Briggs J M, Wade R C, Gabdoulline R R. In: Encyclopedia of Computational Chemistry. von Rague Schleyer P, Allinger N L, Clark T, Gasteiger J, Kollman P A, Schaefer H F, editors. Chichester, U.K.: Wiley; 1998. , in press.
    1. Getzoff E D, Cabelli D E, Fisher C L, Parge H E, Viezzoli M S, Banci L, Hallewell R A. Nature (London) 1992;358:347–351. - PubMed

Publication types

LinkOut - more resources