

The vibrational energy flow transition in organic molecules: theory meets experiment
- PMID: 9600899
- PMCID: PMC27567
- DOI: 10.1073/pnas.95.11.5960
The vibrational energy flow transition in organic molecules: theory meets experiment
Abstract
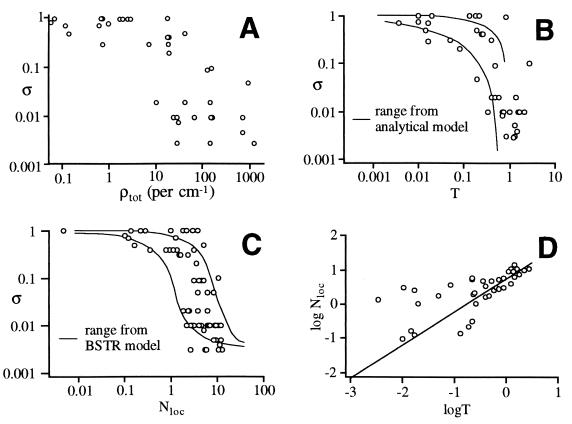
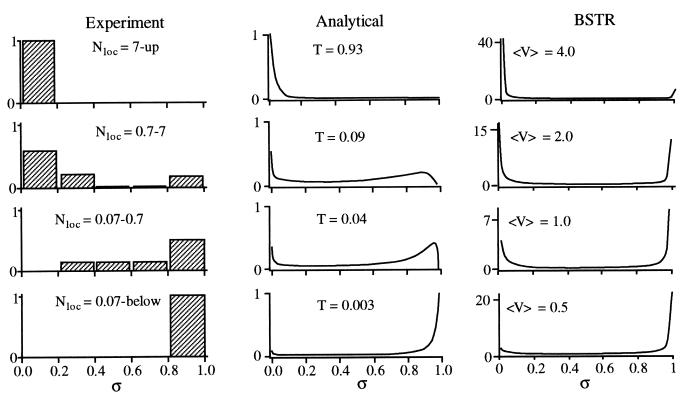
Most large dynamical systems are thought to have ergodic dynamics, whereas small systems may not have free interchange of energy between degrees of freedom. This assumption is made in many areas of chemistry and physics, ranging from nuclei to reacting molecules and on to quantum dots. We examine the transition to facile vibrational energy flow in a large set of organic molecules as molecular size is increased. Both analytical and computational results based on local random matrix models describe the transition to unrestricted vibrational energy flow in these molecules. In particular, the models connect the number of states participating in intramolecular energy flow to simple molecular properties such as the molecular size and the distribution of vibrational frequencies. The transition itself is governed by a local anharmonic coupling strength and a local state density. The theoretical results for the transition characteristics compare well with those implied by experimental measurements using IR fluorescence spectroscopy of dilution factors reported by Stewart and McDonald [Stewart, G. M. & McDonald, J. D. (1983) J. Chem. Phys. 78, 3907-3915].
Figures
References
-
- Uzer T. Phys Rep. 1991;199:73–146.
-
- Marcus R A. J Chem Phys. 1952;20:359–364.
-
- Abramson E, Field R W, Imre D, Innes K K, Kinsey J L. J Chem Phys. 1984;80:2298–2300.
-
- Gambogi J E, Kerstel E R T, Lehmann K K, Scoles G. J Chem Phys. 1993;100:2612–2622.
-
- Maynard A T, Wyatt R E. J Chem Phys. 1995;103:8372–8390.
LinkOut - more resources
Full Text Sources
