. 1998 May 26;95(11):6073-8.
doi: 10.1073/pnas.95.11.6073.

Assessing sequence comparison methods with reliable structurally identified distant evolutionary relationships

Affiliations

Assessing sequence comparison methods with reliable structurally identified distant evolutionary relationships

S E Brenner et al. Proc Natl Acad Sci U S A. .

Abstract

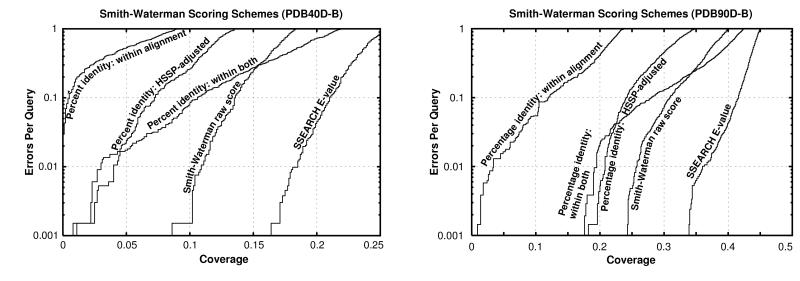
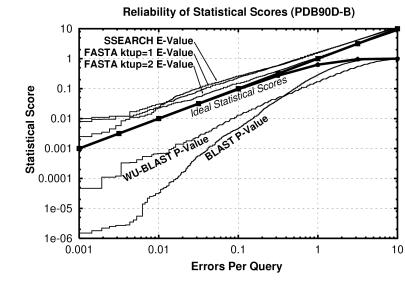
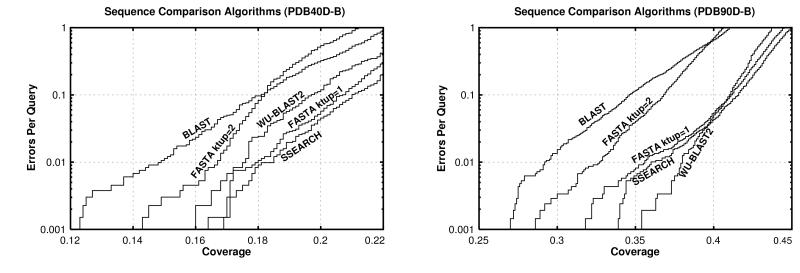
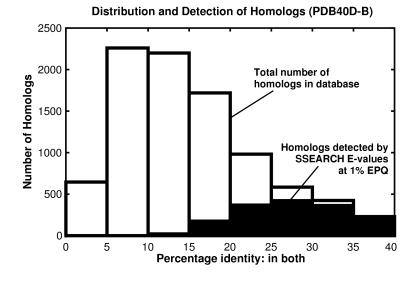
Pairwise sequence comparison methods have been assessed using proteins whose relationships are known reliably from their structures and functions, as described in the SCOP database [Murzin, A. G., Brenner, S. E., Hubbard, T. & Chothia C. (1995) J. Mol. Biol. 247, 536-540]. The evaluation tested the programs BLAST [Altschul, S. F., Gish, W., Miller, W., Myers, E. W. & Lipman, D. J. (1990). J. Mol. Biol. 215, 403-410], WU-BLAST2 [Altschul, S. F. & Gish, W. (1996) Methods Enzymol. 266, 460-480], FASTA [Pearson, W. R. & Lipman, D. J. (1988) Proc. Natl. Acad. Sci. USA 85, 2444-2448], and SSEARCH [Smith, T. F. & Waterman, M. S. (1981) J. Mol. Biol. 147, 195-197] and their scoring schemes. The error rate of all algorithms is greatly reduced by using statistical scores to evaluate matches rather than percentage identity or raw scores. The E-value statistical scores of SSEARCH and FASTA are reliable: the number of false positives found in our tests agrees well with the scores reported. However, the P-values reported by BLAST and WU-BLAST2 exaggerate significance by orders of magnitude. SSEARCH, FASTA ktup = 1, and WU-BLAST2 perform best, and they are capable of detecting almost all relationships between proteins whose sequence identities are >30%. For more distantly related proteins, they do much less well; only one-half of the relationships between proteins with 20-30% identity are found. Because many homologs have low sequence similarity, most distant relationships cannot be detected by any pairwise comparison method; however, those which are identified may be used with confidence.


Figures

Figure 1
Figure 1
Coverage vs. error plots of different scoring schemes for ssearch Smith–Waterman. (A) Analysis of pdb40d-b database. (B) Analysis of pdb90d-b database. All of the proteins in the database were compared with each other using the ssearch program. The results of this single set of comparisons were considered using five different scoring schemes and assessed. The graphs show the coverage and errors per query (EPQ) for statistical scores, raw scores, and three measures using percentage identity. In the coverage vs. error plot, the x axis indicates the fraction of all homologs in the database (known from structure) which have been detected. Precisely, it is the number of detected pairs of proteins with the same fold divided by the total number of pairs from a common superfamily. pdb40d-b contains a total of 9,044 homologs, so a score of 10% indicates identification of 904 relationships. The y axis reports the number of EPQ. Because there are 1,323 queries made in the pdb40d-b all-vs.-all comparison, 13 errors corresponds to 0.01, or 1% EPQ. The y axis is presented on a log scale to show results over the widely varying degrees of accuracy which may be desired. The scores that correspond to the levels of EPQ and coverage are shown in Fig. 4 and Table 1. The graph demonstrates the trade-off between sensitivity and selectivity. As more homologs are found (moving to the right), more errors are made (moving up). The ideal method would be in the lower right corner of the graph, which corresponds to identifying many evolutionary relationships without selecting unrelated proteins. Three measures of percentage identity are plotted. Percentage identity within alignment is the degree of identity within the aligned region of the proteins, without consideration of the alignment length. Percentage identity within both is the number of identical residues in the aligned region as a percentage of the average length of the query and target proteins. The hssp equation (17) is H = 290.15l−0.562 where l is length for 10 < l < 80; H > 100 for l < 10; H = 24.7 for l > 80. The percentage identity hssp-adjusted score is the percent identity within the alignment minus H. Smith–Waterman raw scores and E-values were taken directly from the sequence comparison program.
Figure 2
Figure 2
Unrelated proteins with high percentage identity. Hemoglobin β-chain (pdb code 1hds chain b, ref. , Left) and cellulase E2 (pdb code 1tml, ref. , Right) have 39% identity over 64 residues, a level which is often believed to be indicative of homology. Despite this high degree of identity, their structures strongly suggest that these proteins are not related. Appropriately, neither the raw alignment score of 85 nor the E-value of 1.3 is significant. Proteins rendered by rasmol (40).
Figure 3
Figure 3
Length and percentage identity of alignments of unrelated proteins in pdb90d-b: Each pair of nonhomologous proteins found with ssearch is plotted as a point whose position indicates the length and the percentage identity within the alignment. Because alignment length and percentage identity are quantized, many pairs of proteins may have exactly the same alignment length and percentage identity. The line shows the hssp threshold (though it is intended to be applied with a different matrix and parameters).
Figure 4
Figure 4
Reliability of statistical scores in pdb90d-b: Each line shows the relationship between reported statistical score and actual error rate for a different program. E-values are reported for ssearch and fasta, whereas P-values are shown for blast and wu-blast2. If the scoring were perfect, then the number of errors per query and the E-values would be the same, as indicated by the upper bold line. (P-values should be the same as EPQ for small numbers, and diverges at higher values, as indicated by the lower bold line.) E-values from ssearch and fasta are shown to have good agreement with EPQ but underestimate the significance slightly. blast and wu-blast2 are overconfident, with the degree of exaggeration dependent upon the score. The results for pdb40d-b were similar to those for pdb90d-b despite the difference in number of homologs detected. This graph could be used to roughly calibrate the reliability of a given statistical score.
Figure 5
Figure 5
Coverage vs. error plots of different sequence comparison methods: Five different sequence comparison methods are evaluated, each using statistical scores (E- or P-values). (A) pdb40d-b database. In this analysis, the best method is the slow ssearch, which finds 18% of relationships at 1% EPQ. fasta ktup = 1 and wu-blast2 are almost as good. (B) pdb90d-b database. The quick wu-blast2 program provides the best coverage at 1% EPQ on this database, although at higher levels of error it becomes slightly worse than fasta ktup = 1 and ssearch.
Figure 6
Figure 6
Distribution and detection of homologs in pdb40d-b. Bars show the distribution of homologous pairs pdb40d-b according to their identity (using the measure of identity in both). Filled regions indicate the number of these pairs found by the best database searching method (ssearch with E-values) at 1% EPQ. The pdb40d-b database contains proteins with <40% identity, and as shown on this graph, most structurally identified homologs in the database have diverged extremely far in sequence and have <20% identity. Note that the alignments may be inaccurate, especially at low levels of identity. Filled regions show that ssearch can identify most relationships that have 25% or more identity, but its detection wanes sharply below 25%. Consequently, the great sequence divergence of most structurally identified evolutionary relationships effectively defeats the ability of pariwise sequence comparison to detect them.

Similar articles

Cited by

References

    1. Altschul S F, Gish W, Miller W, Myers E W, Lipman D J. J Mol Biol. 1990;215:403–410. - PubMed
    1. Altschul S F, Gish W. Methods Enzymol. 1996;266:460–480. - PubMed
    1. Pearson W R, Lipman D J. Proc Natl Acad Sci USA. 1988;85:2444–2448. - PMC - PubMed
    1. Murzin A G, Brenner S E, Hubbard T, Chothia C. J Mol Biol. 1995;247:536–540. - PubMed
    1. Brenner S E, Chothia C, Hubbard T J P, Murzin A G. Methods Enzymol. 1996;266:635–643. - PubMed

Publication types