. 1998 May 26;95(11):6108-13.
doi: 10.1073/pnas.95.11.6108.

Role of the J-domain in the cooperation of Hsp40 with Hsp70

Affiliations

Role of the J-domain in the cooperation of Hsp40 with Hsp70

M K Greene et al. Proc Natl Acad Sci U S A. .

Abstract

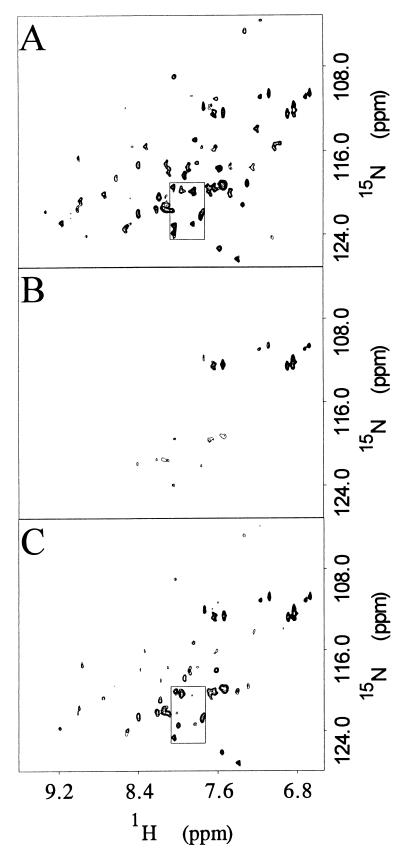
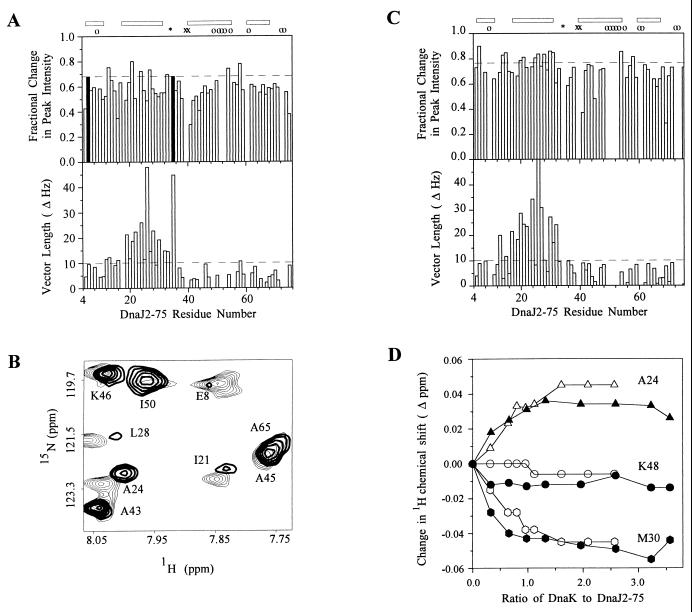
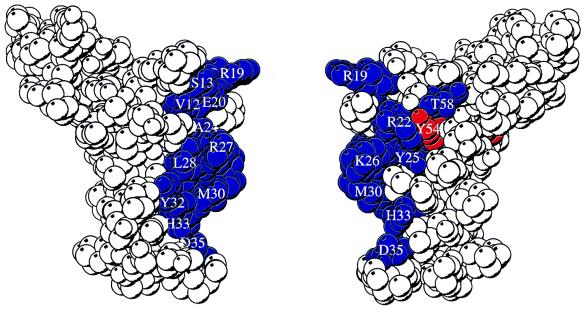
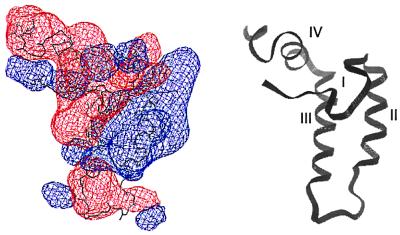
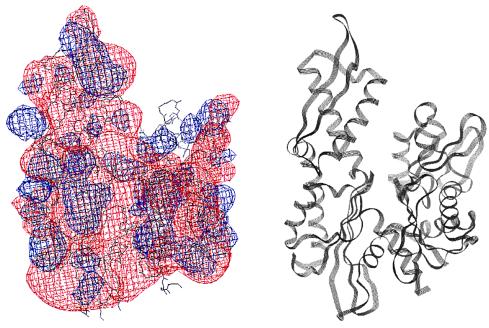
The Escherichia coli Hsp40 DnaJ and Hsp70 DnaK cooperate in the binding of proteins at intermediate stages of folding, assembly, and translocation across membranes. Binding of protein substrates to the DnaK C-terminal domain is controlled by ATP binding and hydrolysis in the N-terminal ATPase domain. The interaction of DnaJ with DnaK is mediated at least in part by the highly conserved N-terminal J-domain of DnaJ that includes residues 2-75. Heteronuclear NMR experiments with uniformly 15N-enriched DnaJ2-75 indicate that the chemical environment of residues located in helix II and the flanking loops is perturbed on interaction with DnaK or a truncated DnaK molecule, DnaK2-388. NMR signals corresponding to these residues broaden and exhibit changes in chemical shifts in the presence of DnaK(MgADP). Addition of MgATP largely reversed the broadening, indicating that NMR signals of DnaJ2-75 respond to ATP-dependent changes in DnaK. The J-domain interaction is localized to the ATPase domain of DnaK and is likely to be dominated by electrostatic interactions. The results suggest that the J-domain tethers DnaK to DnaJ-bound substrates, which DnaK then binds with its C-terminal peptide-binding domain.


Figures

Figure 1
Figure 1
Portions of three two-dimensional 1H-15N HSMQC spectra of [15N]DnaJ2–75 are shown. (A) 0.0:1.0 DnaK(MgADP) to DnaJ2–75 molar ratio. (B) 0.96:1.0 DnaK(MgADP) to DnaJ2–75 molar ratio. (C) 2.57:1.0 DnaK to DnaJ2–75 plus MgATP. B and C have been plotted at levels adjusted to compensate for changes in sample volume. All cross peaks are in the region plotted except that for D35, which is displaced downfield. The boxed region corresponds to the expanded view in Fig. 2B.
Figure 2
Figure 2
(A, Upper) Fractional change in peak intensity at 0.32:1.0 DnaK(MgADP) to DnaJ2–75 plotted against DnaJ2–75 residue number. The horizontal dashed line is the cutoff for residues among the 10% most sensitive to line broadening by DnaK(MgADP) and for mapping onto the DnaJ2–75 structure (Fig. 3). Residues that broadened beyond detection at 0.96:1 DnaK(MgADP)/DnaJ2–75 are shown as black bars of uniform height. The position of proline 34 is indicated by ∗. G39 and D40 for which the NH groups exchange rapidly with solvent are indicated by x. Residues 9, 49, 51, 52, 53, 55, 61, 72, and 73 could not be monitored quantitatively because of spectral overlap, and their positions are indicated by o. The positions of helices I–IV of DnaJ2–75 are indicated by bars at the top. (A, Lower) Combined 1H/15N DnaK(MgATP)-induced chemical shift changes measured as the length of the resultant vector in hertz plotted against DnaJ2–75 residue number. The horizontal dashed line at 10 Hz is the cutoff for residues considered to be most perturbed and for mapping onto the structure of DnaJ2–75. (B) Superposition of a selected region of two-dimensional 1H-15N HSMQC spectra of [15N]DnaJ2–75 alone (light contours) and in the presence of DnaK(MgATP) (heavy contours). The spectrum of DnaJ2–75 with DnaK(MgATP) was plotted at a level that compensates for dilution of the sample. Residues I21, A24, and L28 were most perturbed in this region of the spectrum whereas residues A43, A45, I50 and A65 changed little. (C, Upper) Fractional change in peak intensity at 0.32:1.0 DnaK2–388(MgADP) to DnaJ2–75 plotted against DnaJ2–75 residue number. The horizontal dashed line is the cutoff for residues most sensitive to line broadening by DnaK2–388(MgADP). Residues 9, 49, 50, 51, 52, 53, 55, 60, 61, 72, and 73 could not be monitored quantitatively because of spectral overlap, and their positions are indicated by o. Other symbols are the same as that in A. (C, Lower) Combined 1H/15N DnaK2–388(MgATP)-induced chemical shift changes measured as the length of the resultant vector in hertz plotted against DnaJ2–75 residue number. The horizontal dashed line at 10 Hz is the cutoff for residues considered to be most perturbed. (D) Titration of [15N]DnaJ2–75 with DnaK(MgADP) and DnaK2–388(MgADP). Proton chemical shift changes are plotted as a function of DnaK(MgADP)/DnaJ2–75 ratio (open symbols) or DnaK2–388:DnaJ2–75 ratio (closed symbols).
Figure 3
Figure 3
Two views of a space-filling depiction of DnaJ2–76 identifying surface-exposed residues perturbed by the interaction with DnaK(MgATP) and DnaK(MgADP). Residues that have greater than 10 Hz shift (defined in Fig. 2A, legend) in the presence of DnaK(MgATP) are colored blue. Residues that are severely broadened in the presence of DnaK(MgADP) but whose chemical shift is not affected in the presence of DnaK(MgATP) are colored red. In the view at right, the molecule has been rotated 180° about the vertical axis relative to the view at left. The figure was prepared by using the program molscript (47) with frame 1 of Protein Data Bank file 1XBL.
Figure 4
Figure 4
(Left) Contours of electrostatic surface potential in and around DnaJ2–76. Blue and red contours indicate potentials of 2kT and −2kT, respectively. The potentials were calculated with the program delphi 95.0 (Molecular Simulations) by using default values for solvent and protein dielectric constants. Helix II contains a large positive surface potential that could interact with an area of negative surface potential on DnaK2–388. (Right) Ribbon diagram of DnaJ2–76 in the same orientation as the molecule to the left with the helices I–IV labeled. The figure was prepared by using frame 1 of Protein Data Bank file 1XBL.
Figure 5
Figure 5
(Left) Contours of potentials in and around DnaK3–383. Contours indicate potentials as specified in the Fig. 4 legend. The potentials were calculated as in Fig. 4 by using Protein Data Bank file 1DKG after removal of all atoms associated with GrpE. (Right) Ribbon diagram of DnaK3–383 in the same orientation as the molecule to the left.

References

    1. Saito H, Uchida H. Mol Gen Genet. 1977;164:1–8. - PubMed
    1. Zylicz M, LeBowitz J H, McMacken R, Georgopoulos C. Proc Natl Acad Sci USA. 1983;80:6431–6435. - PMC - PubMed
    1. Wickner S, Hoskins J, McKenney K. Proc Natl Acad Sci USA. 1991;88:7903–7907. - PMC - PubMed
    1. Wild J, Altman E, Yura T, Gross C A. Genes Dev. 1992;6:1165–1172. - PubMed
    1. Liberek K, Georgopoulos C. Proc Natl Acad Sci USA. 1993;90:11019–11023. - PMC - PubMed

Publication types

MeSH terms

LinkOut - more resources