. 1998 May 26;95(11):6139-44.
doi: 10.1073/pnas.95.11.6139.

Differential expression of dystrophin isoforms and utrophin during dibutyryl-cAMP-induced morphological differentiation of rat brain astrocytes

Affiliations

Differential expression of dystrophin isoforms and utrophin during dibutyryl-cAMP-induced morphological differentiation of rat brain astrocytes

M Imamura et al. Proc Natl Acad Sci U S A. .

Abstract

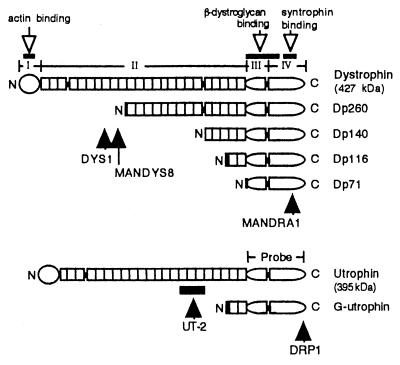
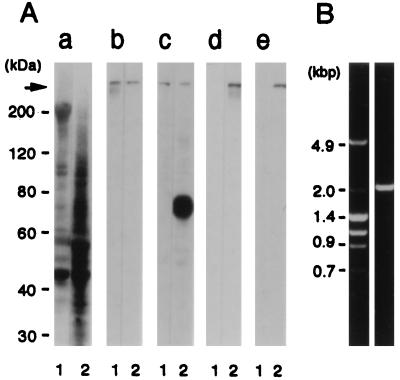
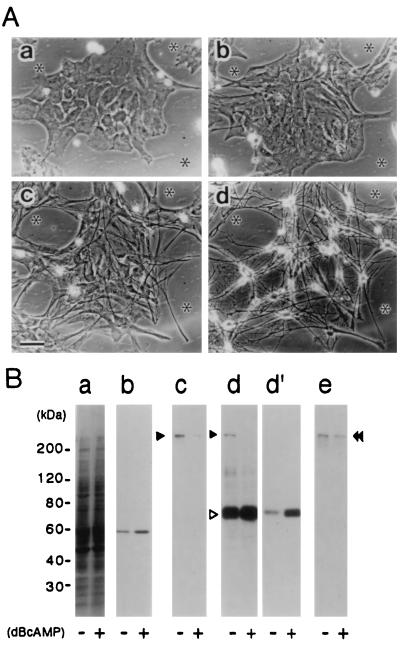
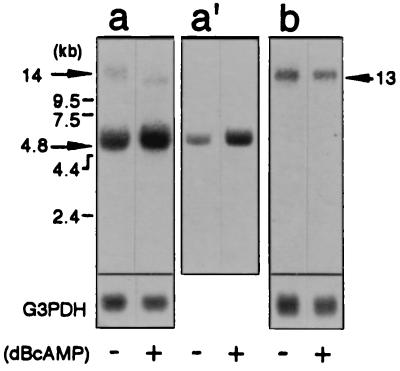
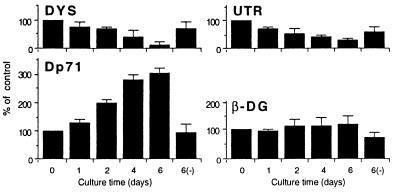
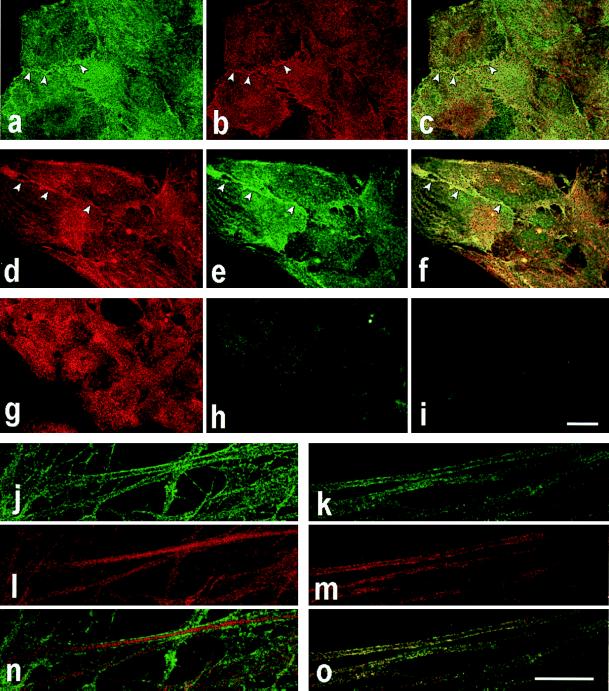
We have identified isoforms of dystrophin and utrophin, a dystrophin homologue, expressed in astrocytes and examined their expression patterns during dibutyryl-cAMP (dBcAMP)-induced morphological differentiation of astrocytes. Immunoblot and immunocytochemical analyses showed that full-length-type dystrophin (427 kDa), utrophin (395 kDa), and Dp71 (75 kDa), a small-type dystrophin isoform, were coexpressed in cultured nondifferentiated rat brain astrocytes and were found to be located in the cell membrane. During morphological differentiation of the astrocytes induced by 1 mM dBcAMP, the amount of Dp71 markedly increased, whereas that of dystrophin and utrophin decreased. Northern blot analyses revealed that dBcAMP regulates the mRNA levels of Dp71 and dystrophin but not that of utrophin. dBcAMP slightly increased the amount of the beta-dystroglycan responsible for anchoring dystrophin isoforms and utrophin to the cell membrane. Immunocytochemical analyses showed that most utrophin was observed in the cytoplasmic area during astrocyte differentiation, whereas Dp71 was found along the cell membrane of the differentiated astrocytes. These findings suggest that most of the dystrophin/utrophin-dystroglycan complex on cell membrane in cultured astrocytes was replaced by the Dp71-dystroglycan complex during morphological differentiation. The cell biological roles of Dp71 are discussed.


Figures

Figure 1
Figure 1
Schematic representations of dystrophin isoforms and utrophin. N and C indicate NH2 and COOH termini of the proteins. Four dystrophin domains, i.e., an actin-binding domain, rod domain, cysteine-rich domain, and a COOH-terminal domain, are indicated as I, II, III, and IV, respectively. Open and solid arrowheads indicate the functional (protein-binding) domains and epitopes recognized by the antibodies DYS1, MANDYS8, MANDRA1, DRP1, and UT-2, respectively. The solid box for utrophin indicates the region corresponding to a recombinant fragment used as an antigen. The region encoded by the cDNA probe used for Northern blotting is indicated as Probe.
Figure 2
Figure 2
Expression of dystrophin and utrophin isoforms in rat cultured astrocytes. (A) Twenty-four micrograms of total protein from rat cultured astrocytes (lanes 2) and eight micrograms of rat skeletal muscle homogenate (lanes 1) were separated on a SDS/polyacrylamide gel and transferred to PVDF membranes. The membranes were stained with Coomassie brilliant blue (panel a), DYS1 (panel b), MANDRA1 (panel c), UT-2 (panel d), and DRP1 (panel e). Arrow indicates the position of the 400-kDa band. (B) Detection of rat astrocyte Dp71 transcripts by RT–PCR. A reverse primer containing a sequence complementary to a sequence in the 3′-untranslated region of mouse dystrophin mRNA was used to reverse transcribe RNA isolated from cultured rat astrocytes. The single-strand cDNA was amplified by PCR using the same reverse primer and a forward primer located within the unique exon 1 of rat Dp71 mRNA (right lane). Size markers are indicated on the left lane.
Figure 3
Figure 3
Time course of morphological differentiation and the expression of dystrophin isoforms in dBcAMP-treated astrocytes. (A) dBcAMP-induced morphological differentiation of rat astrocytes. Serial phase-contrast micrographs of rat brain astrocytes cultured in DMEM supplemented with 1 mM dBcAMP and 1% HS at day 0 (a), 2 (b), 4 (c), and 6 (d). Asterisks in each micrograph indicate the same positions on a culture dish. (Bar = 50 μm.) (B) Effect of dBcAMP on expression of dystrophin isoforms in astrocytes. Twenty micrograms of total proteins from astrocytes cultured for 6 days in the presence (+) or absence (−) of 1 mM dBcAMP were analyzed by immunoblotting (panels a, c, d, and e). The membranes were stained with Coomassie brilliant blue (panel a), anti-GFAP (G5A) (panel b), DYS1 (panel c), MANDRA1 (panels d and d′), and anti-utrophin rabbit antiserum (panel e). For panels b and d′, 0.2 and 2 μg of the total proteins were transferred to the membranes, respectively. Solid and open arrowheads indicate the bands representing full-length dystrophin and Dp71, respectively. Double arrowheads indicate the band representing utrophin.
Figure 4
Figure 4
The effect of dBcAMP on dystrophin, Dp71, and utrophin mRNA expression in cultured astrocytes. Five micrograms of poly(A)-rich RNA from rat cultured astrocytes was separated by electrophoresis, transferred to a nylon membrane, and hybridized with 32P-labeled rat Dp71 (panels a and a′) PCR products and utrophin (panel b) cDNA. The hybridization signals (arrows) were visualized following autoradiography for 18 hr (panels a and b) and 2 hr (panel a′) by use of a BAS2000 image analyzer. RNA samples: astrocytes cultured for 6 days in the absence (−) and presence (+) of 1 mM dBcAMP. The filters used for panels a and a′ were the same. The membrane was rehybridized with a 32P-labeled human glyceraldehyde-3-phosphate dehydrogenase (G3PDH) cDNA probe to correct for the amount of RNA loaded in each lane.
Figure 5
Figure 5
The expression of dystrophin isoforms, utrophin and β-dystroglycan, during dBcAMP-induced astrocyte differentiation. The astrocytes cultured in DMEM supplemented with 1 mM dBcAMP and 1% HS at day 0, 1, 2, 4, and 6 were lysed in SDS solution. These lysates were used for quantitative analysis of full-length dystrophin (DYS), utrophin (UTR), Dp71, and β-dystroglycan (β-DG) as described. The protein level (mean ± SD from three independent experiments) at each time point was expressed as a percentage of the amount of protein compared with that on day 0 of culture. The astrocytes cultured for 6 days in control medium (+1% HS without dBcAMP) are indicated as 6(−).
Figure 6
Figure 6
Immunofluorescence staining of dystrophin, Dp71, and utrophin in cultured astrocytes. The rat brain astrocytes, cultured in DMEM supplemented with 1% HS for 8 days in the absence (ai) and presence (jo) of 1 mM dBcAMP, were stained. The undifferentiated polygonal cells were double-stained with anti-β-dystroglycan (NCL-43DAG) (a) and anti-utrophin (UT-2) (b), anti-β-dystroglycan (PA3a) (d) and anti-COOH-terminal region of dystrophin (MANDRA1) (e), anti-β-dystroglycan (PA3a) (g), and anti-full-length dystrophin (MANDYS8) (h). c and f show the merged images. Polyclonal (b, d, and g) and monoclonal (a, e, and h) antibodies are visualized with TRITC-labeled anti-rabbit (red) and FITC-labeled anti-mouse (green) secondary antibodies, respectively. i is the control of e and h, which was incubated with only FITC-labeled anti-mouse secondary antibody. Arrowheads indicate regions of cell-to-cell contact. Processes of the differentiated cells were double-stained with NCL-43DAG (j), and UT-2 (l), PA3a (k), and MANDRA1 (m). n and o show the merged images. NCL-43DAG and PA3a were visualized with FITC-labeled (green) anti-mouse and anti-rabbit antibody, respectively. UT-2 and MANDRA1 were visualized with TRITC-labeled (red) anti-rabbit and anti-mouse secondary antibody, respectively. (Bars = 20 μm.)

Similar articles

Cited by

References

    1. Ozawa E, Yoshida M, Suzuki A, Mizuno Y, Hagiwara Y, Noguchi S. Hum Mol Genet. 1995;4:1711–1716. - PubMed
    1. Sadoulet-Puccio H M, Kunkel L M. Brain Pathol. 1996;6:25–35. - PubMed
    1. Love D R, Hill D F, Dickson G, Spurr N K, Byth B C, Marsden R F, Walsh F S, Edwards Y H, Davies K E. Nature (London) 1989;339:55–58. - PubMed
    1. Blake D J, Love D R, Tinsley J, Morris G E, Turley H, Gatter K, Dickson G, Edwards Y H, Davies K E. Hum Mol Genet. 1992;1:103–109. - PubMed
    1. Tinsley J M, Blake D J, Roche A, Fairbrother U, Riss J, Byth B C, Knight A E, Kendrick-Jones J, Suthers G K, Love D R, Edwards Y H, Davies K E. Nature (London) 1992;360:591–593. - PubMed

Publication types

Associated data

LinkOut - more resources