. 1998 May 26;95(11):6175-80.
doi: 10.1073/pnas.95.11.6175.

Transcytosis of alpha1-acidic glycoprotein in the continuous microvascular endothelium

Affiliations

Transcytosis of alpha1-acidic glycoprotein in the continuous microvascular endothelium

D Predescu et al. Proc Natl Acad Sci U S A. .

Abstract

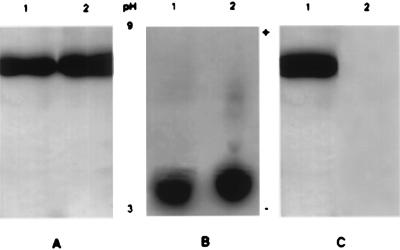
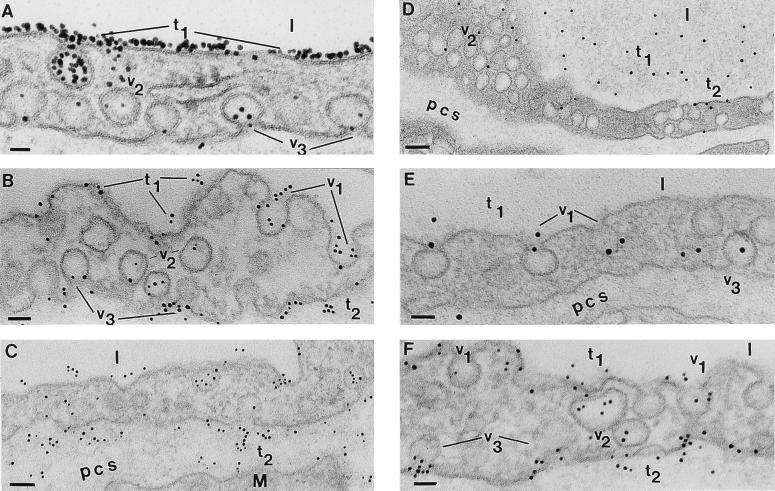
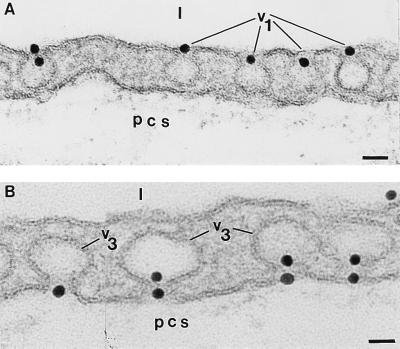
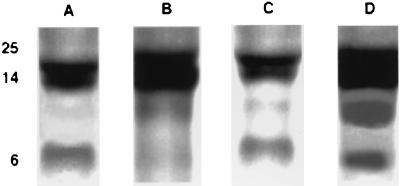
By using perfusions and bolus administration, coupled with postembedding immunocytochemical procedures, we have identified the structures involved in the transport of derivatized orosomucoid (alpha1-acidic glycoprotein) across the continuous microvascular endothelium of the murine myocardium. Our findings indicate that: (i) monomeric orosomucoid binds to the luminal surface of the endothelium; (ii) it is restricted to caveolae during its transport across the endothelium; (iii) it is detected in the perivascular spaces at early time points (by 1 min) and in larger quantities at later time points (>5 min) from the beginning of its perfusion or its intravascular administration; (iv) no orosomucoid molecules are found in the intercellular junctions or at the abluminal exits of interendothelial spaces; and (v) the vesicular transport of orosomucoid is strongly inhibited by N-ethylmaleimide (>80%). Because, by size and shape, the orosomucoid qualifies as a preferential probe for the postulated small pore system, our results are discussed in relation to the pore theory of capillary permeability.


Figures

Figure 1
Figure 1
Characterization of the tracers. (A) The derivatized Om as well as the native molecule have the same migration behavior in SDS/PAGE. Om-DNP (5 μg) in lane 1 and native Om (5 μg) in lane 2 were run at 150 V for 90 min. The minigels were stained with Coomassie blue R-250. (B) Immunoelectrophoresis on a 1% agarose gel shows that the net electric charge of Om-DNP (lane 1) is not significantly different from that of native Om (lane 2). The ampholytes used were pH 3–9, and the direction of pH gradient is indicated by the + and − signs. Every lane was loaded with 7 μg of protein. (C) SDS/PAGE of Om-DNP transferred to nitrocellulose paper (1 h at 700 mA) and blotted with anti-DNP antibody (diluted 1:2000). Only Om-DNP is recognized by the antibody (lane 1); the native Om in lane 2 does not give a signal. Each lane was loaded with 5 μg of protein.
Figure 2
Figure 2
Postembedding immunodetection of Om-DNP in perfused and bolus-administered specimens. (A) Capillary profile in a specimen perfused for 5 min with Om-DNP (at 5 mg/ml). The luminal endothelial surface is extensively labeled by the tracer (t1). Inside the endothelium only a few caveolae (v2) are labeled, but even at this early time, caveolae (v3) discharging their content could be seen. l, lumen. (Bar = 35 nm.) (B) After 15 min Om-DNP molecules are associated with the luminal plasmalemma (t1), with caveolae opened to the lumen (v1), with caveolae apparently free in the cytosol (v2), and with caveolae that are discharging their content into the pericapillary spaces (v3). Note also the presence of apparently free tracer molecules (t2) in the perivascular spaces. (Bar = 60 nm.) (C) As time of perfusion progresses (30 min), the tracer is found all over the endothelial profile with the same distribution as in B, but the label density (t2) over the perivascular spaces is much more extensive. M, muscle; pcs, pericapillary space(s). (Bar = 84 nm.) (D) After 5 min of an i.v. injection of 100 μl from a concentrated Om-DNP solution (of 50 mg/ml), the tracer is present in the lumina of the vessels (t1), associated with the plasmalemma proper (t2), with the caveolae opened to the luminal and abluminal (v3) side of the endothelium, and with caveolae apparently free in the cytosol (v2). (Bar = 100 nm.) (E) At 15 min from bolus administration of Om-DNP the majority of the tracer is still found in the lumen (t1). The tracer molecules label more extensively caveolae opened to the lumen (v1) as well as caveolae that are discharging their content (v3) in the perivascular spaces. (Bar = 52 nm.) (F) Thirty minutes after i.v. administration, the tracer is still found in the lumina (t1) but many caveolae opened to the lumen (v1) or scattered inside the cells (v2) are labeled, as are the caveolae (v3) discharging on the abluminal front of the cell; some of the latter contain multiple tracer molecules. Note the extensive labeling (t2) of the perivascular spaces at this time, resembling that found in perfused specimens; yet its density remains much lower than that encountered in perfused specimens (compare with C). (Bar = 53 nm.)
Figure 3
Figure 3
Binding pattern of Om-Au. (A) When Om-Au (≈22 nm diameter) was perfused as in Fig. 2 A–C, the necks of many caveolae opened to the lumina (v1) were plugged by the tracer. (Bar = 49 nm.) (B) By 15 min of perfusion, the gold coated particles are seen plugging the necks of the caveolae (v3) opened on the abluminal front of the cells. Not so often, the necks of some caveolae (v3) opened on the tissular side of endothelial cells are plugged with two gold particles. (Bar = 28 nm.) l, lumen; pcs, pericapillary space(s); the same abbreviations are used for Fig. 4.
Figure 4
Figure 4
NEM effect on Om-DNP transcytosis. (A) Graphic representation of the amount of Om-DNP, expressed as protein equivalents, transported in the presence of NEM (broken line) and in the absence of NEM (continuous line) in perfused murine hearts. Tracer amounts were determined in 8–10 consecutive experiments (4–6 mice per experiment), and ELISAs were performed in duplicates for three different dilutions. Tracer perfusions were for 15 min as described in the text. Every point on the graphs is a mean value of ≈35 determinations with standard deviation given. (B) An electron micrograph taken from one of the mice used to quantitate Om-DNP transcytosis in the presence of NEM. The normal endothelial morphology, the lack of any detectable structural alteration, and the drastic reduction in labeling of endothelial caveolae and perivascular spaces (compare with Fig. 2 B, C, E, and F) at the end of a 20-min exposure to 1 mM NEM are illustrated by this micrograph. (Bar = 84 nm.)
Figure 5
Figure 5
Detection of Om binding proteins by ligand blotting. Lysates of different endothelial cell types—namely bovine microvascular cells (A), bovine pulmonary vein (B), bovine pulmonary artery (C), and human umbilical veins (D)—were subjected to electrophoresis on SDS/5–20% polyacrylamide minigels under nondenaturing conditions. After transfer, the nitrocellulose strips were incubated with 125I-Om for 1 h at room temperature, washed extensively, and exposed to Kodak XAR 5 film for 1 h. Apparent molecular masses in kDa are indicated on the side. In all endothelial cell types so far examined, we found an upper doublet within 14–20 kDa and a third, lower, band around 7 kDa.

Similar articles

Cited by

References

    1. McPherson A, Friedman M L, Halsall H B. Biochem Biophys Res Commun. 1984;124:619–624. - PubMed
    1. Schmid K. In: The Plasma Proteins. Putnam F W, editor. Vol. 1. San Francisco: Academic; 1975. pp. 183–229.
    1. Schmid K. In: Alpha1-Acid Glycoprotein: Genetics, Biochemistry, Physiological Functions and Pharmacology. Baumann P, Müller W E, Eap C B, Tillement J-P, editors. New York: Liss; 1989. pp. 7–22.
    1. Haraldsson B. Acta Physiol Scand. 1985;123:427–436. - PubMed
    1. Haraldsson B, Ripe B. Acta Physiol Scand. 1987;129:127–135. - PubMed

Publication types

LinkOut - more resources