. 1998 May 26;95(11):6302-7.
doi: 10.1073/pnas.95.11.6302.

Visualizing the dynamics of T cell activation: intracellular adhesion molecule 1 migrates rapidly to the T cell/B cell interface and acts to sustain calcium levels

Affiliations

Visualizing the dynamics of T cell activation: intracellular adhesion molecule 1 migrates rapidly to the T cell/B cell interface and acts to sustain calcium levels

C Wülfing et al. Proc Natl Acad Sci U S A. .

Abstract

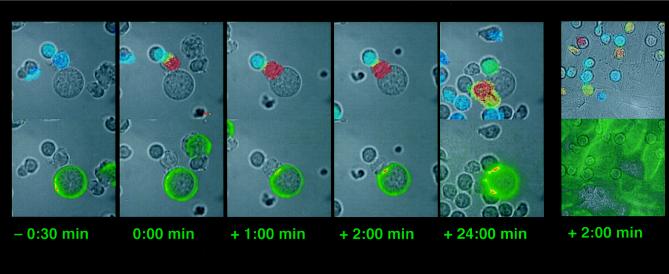
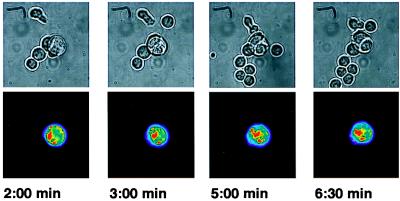
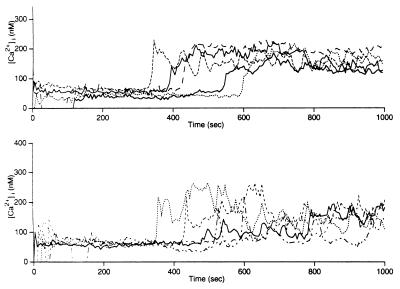
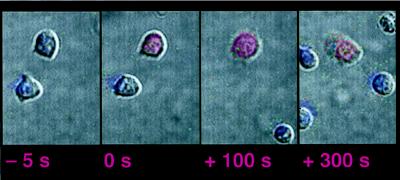
T cell recognition typically involves both the engagement of a specific T cell receptor with a peptide/major histocompatibility complex (MHC) and a number of accessory interactions. One of the most important interactions is between the integrin lymphocyte function-associated antigen 1 (LFA-1) on the T cell and intracellular adhesion molecule 1 (ICAM-1) on an antigen-presenting cell. By using fluorescence video microscopy and an ICAM-1 fused to a green fluorescent protein, we find that the elevation of intracellular calcium in the T cell that is characteristic of activation is followed almost immediately by the rapid accumulation of ICAM-1 on a B cell at a tight interface between the two cells. This increased density of ICAM-1 correlates with the sustained elevation of intracellular calcium in the T cell, known to be critical for activation. The use of peptide/MHC complexes and ICAM-1 on a supported lipid bilayer to stimulate T cells also indicates a major role for ICAM-1/LFA-1 in T cell activation but, surprisingly, not for adhesion, as even in the absence of ICAM-1 the morphological changes and adhesive characteristics of an activated T cell are seen in this system. We suggest that T cell antigen receptor-mediated recognition of a very small number of MHC/peptide complexes could trigger LFA-1/ICAM-1 clustering and avidity regulation, thus amplifying and stabilizing the production of second messengers.


Figures

Figure 1
Figure 1
Mobilization of ICAM-1/GFP during T cell recognition of B cells and MHC II-transfected CHO cells. Each panel consists of two identical bright-field images. The upper one is overlaid with a transparent color scale of the ratio of the fluorescence emissions at 340 nm and 380 nm of the calcium sensitive dye Fura-2. This ratio is correlated with the intracellular calcium concentration. Blue indicates low, resting calcium; and red, high calcium. The bottom bright-field image is overlaid with a transparent color scale of the GFP fluorescence. Green indicates low ICAM-GFP concentration, yellow medium, and red high. The five left panels show a time course for the interaction of a T cell with a B cell. Time points of the interaction are given with the time before or after activation indicated below each panel. The second T cell activating on the central B cell is slightly above the plane of focus of the objective; thus the recorded GFP fluorescence is reduced. The sixth panel at the right shows the activation of T cells by an I-Ek-transfected CHO cell 2 min after the activation of the middle T cell. The movies from which these photos are derived can be viewed at http://cmgm.stanford.edu/hhmi/mdavis.
Figure 2
Figure 2
Capturing the T/B cell interface in a different orientation. Two T cells, activated by one ICAM-1-transfected CH27 B cell, are shown. The T cells have moved under the larger CH27 cell after activation, with the result that the focal plane of the microscope is now at the B/T cell interface (versus the side view of Fig. 1). One cell lies under the top left part of the CH27 cell, the other under the bottom right part. The other T cells in the images are not activated. In the upper row are bright-field images, in the bottom row the ICAM-1/GFP fluorescence images. The fluorescence intensity is encoded in a rainbow color scheme, which represent linear variations in intensity, because the images have been collected with a cooled CCD camera. The time after the activation of the bottom right cell is indicated below each panel. The top left cell has activated 7 min before this. T cell activation was determined by monitoring the intracellular calcium concentration (data not shown).
Figure 3
Figure 3
Types of calcium signals. Five traces were taken from one experiment each, where 5C.C7 T cells have been stimulated with CHO cells transfected with I-Ek and ICAM-GFP. (Upper) A stable sustained phase induced by high ICAM-1 expression levels. (Lower) A reduced sustained phase found with low ICAM-1 expression levels (see Table 1).
Figure 4
Figure 4
Activation of T cells on supported lipid bilayers containing I-Ek. The figure setup is as in the upper panels in Fig. 1. The original movie is available at http://cmgm.stanford.edu/hhmi/mdavis.

Similar articles

Cited by

References

    1. Dustin M L, Bromley S K, Kan Z, Peterson D A, Unanue E R. Proc Natl Acad Sci USA. 1997;94:3909–3913. - PMC - PubMed
    1. Negulescu P A, Krasieva T B, Khan A, Kerschbaum H H, Cahalan M D. Immunity. 1996;4:421–430. - PubMed
    1. Donnadieu E, Bismuth G, Trautmann A. Curr Biol. 1994;4:584–595. - PubMed
    1. Weiss A, Littman D R. Cell. 1994;76:263–274. - PubMed
    1. Premack B A, Gardner P. Am J Physiol. 1992;263:C1119–C1140. - PubMed

Publication types