. 1998 May 26;95(11):6388-93.
doi: 10.1073/pnas.95.11.6388.

Increased rates of CD4(+) and CD8(+) T lymphocyte turnover in simian immunodeficiency virus-infected macaques

Affiliations

Increased rates of CD4(+) and CD8(+) T lymphocyte turnover in simian immunodeficiency virus-infected macaques

M Rosenzweig et al. Proc Natl Acad Sci U S A. .

Abstract

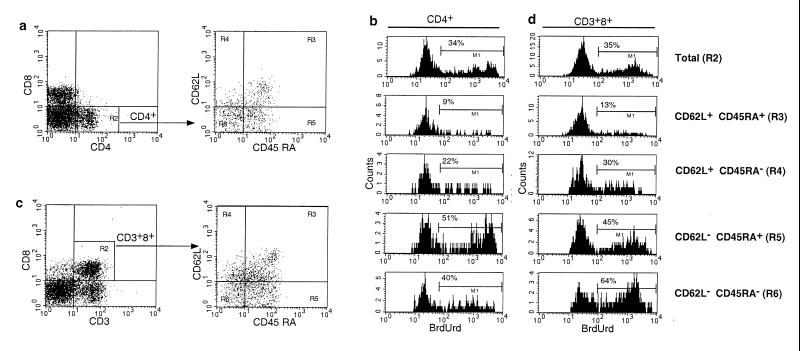
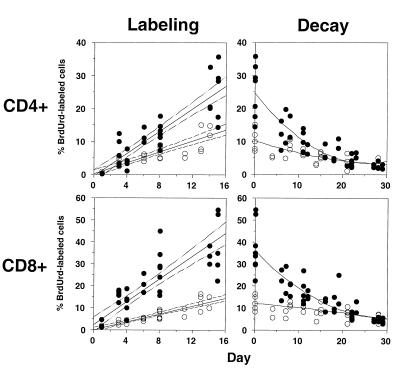
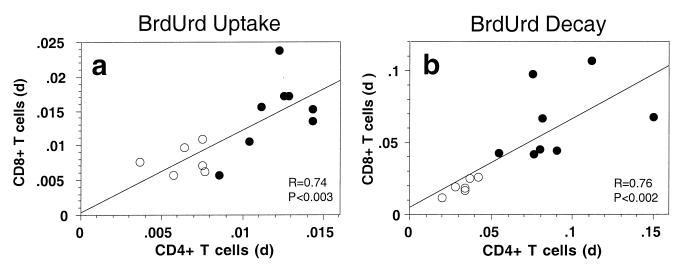
Defining the rate at which T cells turn over has important implications for our understanding of T lymphocyte homeostasis and AIDS pathogenesis, yet little information on T cell turnover is available. We used the nucleoside analogue bromodeoxyuridine (BrdUrd) in combination with five-color flow cytometric analysis to evaluate T lymphocyte turnover rates in normal and simian immunodeficiency virus (SIV)-infected rhesus macaques. T cells in normal animals turned over at relatively rapid rates, with memory cells turning over more quickly than naive cells. In SIV-infected animals, the labeling and elimination rates of both CD4(+) and CD8(+) BrdUrd-labeled cells were increased by 2- to 3-fold as compared with normal controls. In normal and SIV-infected animals, the rates of CD4(+) T cell BrdUrd-labeling and decay were closely correlated with those of CD8(+) T cells. The elimination rate of BrdUrd-labeled cells was accelerated in both naive and memory T lymphocytes in SIV-infected animals. Our results provide direct evidence for increased rates of both CD4(+) and CD8(+) T cell turnover in AIDS virus infection and have important implications for our understanding of T cell homeostasis and the mechanisms responsible for CD4(+) T cell depletion in AIDS.


Figures

Figure 1
Figure 1
Five-color flow cytometry analysis of in vivo BrdUrd labeling in an SIV-infected macaque. Peripheral blood lymphocytes from an SIV-infected rhesus macaque that had been labeled with BrdUrd were surface stained with antibodies to CD3, CD8, CD45RA, and CD62L or CD4, CD8, CD45RA, and CD62L, then permeabilized, and stained with antibodies to BrdUrd. (a) Gating of CD4+ T lymphocytes. Cells enclosed in the gate designated by R2 then were analyzed for expression of CD45RA and CD62L. (b) Analysis of BrdUrd uptake in memory and naive populations of CD4+ T cells. (c) Gating of CD8+ T lymphocytes. To exclude CD3CD8+ natural killer cells, subsequent analysis of expression of CD45RA, CD62L, and BrdUrd was confined to CD3+CD8+ cells indicated in the R2 gate. (d) Analysis of BrdUrd uptake in memory and naive populations of CD8+ T cells. The gate corresponding to each population of naive and memory cells is indicated in parentheses. The percentage of BrdUrd-labeled cells for each gated cell population is shown in each histogram.
Figure 2
Figure 2
Serial analysis of BrdUrd-labeled cells during BrdUrd labeling and decay in normal and SIV-infected macaques. Macaques were labeled with BrdUrd for ≈2 wk and then observed during a washout phase of 4 wk. The percentage of BrdUrd-labeled cells was determined in peripheral blood lymphocytes twice a week for the duration of labeling and washout phases. Each symbol represents an individual time point for a given animal; open circles are normal animals, and filled circles are SIV-infected animals. For the labeling phase, a linear regression of the percentage of BrdUrd-labeled cells with 95% confidence intervals is shown for normal and SIV-infected animals. For the decay phase, a nonlinear regression of the percentage of BrdUrd-labeled cells is shown for normal and SIV-infected animals.
Figure 3
Figure 3
Correlation of BrdUrd labeling and decay rates of CD4+ and CD8+ T cells. (a) Correlation of the labeling coefficients for uptake of BrdUrd by CD4+ and CD8+ T lymphocytes during administration of BrdUrd to normal and SIV-infected animals. Labeling coefficients were calculated by linear regression analysis. (b) Correlation of the elimination rates for BrdUrd-labeled CD4+ and CD8+ T lymphocytes after stopping administration of BrdUrd to normal and SIV-infected animals. The elimination rate of BrdUrd-labeled CD4+ and CD8+ T lymphocytes was calculated by nonlinear regression analysis. Each symbol represents an individual animal; open circles are normal animals, and closed circles are SIV-infected animals. R and P values for linear regressions for both uptake and decay rates are shown.

Similar articles

Cited by

References

    1. Roederer M. Nat Med. 1995;1:621–622. - PubMed
    1. Freitas A A, Rocha B B. Immunol Today. 1993;14:25–29. - PubMed
    1. Tough D F, Sprent J. J Exp Med. 1994;179:1127–1135. - PMC - PubMed
    1. Penit C. J Immunol. 1986;137:2115–2121. - PubMed
    1. Rocha B, Penit C, Baron C, Vasseur F, Dautigny N, Freitas A A. Eur J Immunol. 1990;20:1697–1708. - PubMed

Publication types

MeSH terms