. 1998 Mar;82(3):267-75.
doi: 10.1136/bjo.82.3.267.

Multifocal electroretinography in patients with Stargardt's macular dystrophy

Affiliations

Multifocal electroretinography in patients with Stargardt's macular dystrophy

U Kretschmann et al. Br J Ophthalmol. 1998 Mar.

Abstract

Aims: To describe the topography of multifocal electroretinograms (ERGs) and to explore its diagnostic value in patients with Stargardt's macular dystrophy (SMD).

Methods: 51 patients with SMD were examined by means of the m-sequence technique to characterise the topography of electroretinographic responses in the central visual field. The results were compared with data from 30 normal volunteers.

Results: In 49 of 51 patients with SMD, macular electroretinographic activity was markedly diminished or non-detectable. Towards more peripheral areas, ERG responses of the SMD patients approached those of normals. Implicit times were not markedly delayed at any eccentricity.

Conclusion: In contrast with Ganzfeld electroretinography, multifocal electroretinography is useful to detect foveal dysfunction in SMD. Areas of dysfunction were found to be usually larger than expected from psychophysical measurements and morphological alteration. In early stages of the disease it was possible to detect foveal dysfunction, even in patients lacking morphological fundus changes and with good visual acuity.


Figures

Figure 1
Figure 1
(A) Geometry of the stimulus. The 61 hexagonal elements were grouped in five rings. (B) Trace array of 61 first order kernel ERG waves from the left eye of a normal volunteer. (C) Response density of the same eye as in (B) calculated as scalar product plotted. The central peak corresponds to the macular area and the minimum on the left to the area of the optic nerve head (blind spot). (D) Averaged ERGs of the five groups indicated in (A) from the same eye as in (B) and (C). The implicit time was measured from stimulus onset to the first positive peak.
Figure 2
Figure 2
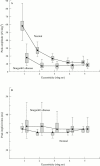
Response density (A) and implicit time (B) in normal controls and patients with SMD versus eccentricity. Numbers on the abscissa indicate eccentricity groups (see Fig 1A). The values were calculated only from data obtained in left eyes. The black dots indicate the median, the shaded box the 25% and 75% quartiles, the end of the error bars the 5% and 95% quantiles.
Figure 3
Figure 3
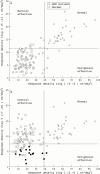
Comparison of response densities of 101 eyes of SMD patients and 30 normal eyes in different topographic regions. Lines indicate the border of 95% percentiles of the normals. In (A) response densities of ring 3 (5°-12°) are plotted against response densities of ring 1 (fovea). In (B) response densities of ring 5 (17°-30°) are plotted against response densities of ring 1 (fovea). Filled squares indicate eyes with pathological photopic Ganzfeld ERGs.
Figure 4
Figure 4
Case 1 left eye. (A) Fundus photograph. (B) Visual field recorded with Tübingen static perimetry, background luminance 10 cd/m2, maximal luminance 1000 cd/m2, stimulus size 10'. Small squares indicate normal light sensitivity, large open squares relative defects of 5-10 dB, large shaded squares relative defects >10 dB, large solid squares absolute defects. (C) Trace array of 61 focal ERGs. (D) Plot of response density.
Figure 5
Figure 5
Case 2 left eye. (A) Fundus photograph. (B) Visual field recorded with Tübingen static perimetry. (C) Trace array of 61 focal ERGs. (D) Plot of response density.
Figure 6
Figure 6
Case 3 both eyes. (A) Fundus photograph (left eye). (B) Fundus photograph (right eye). (C) Visual field recorded with Tübingen static perimetry (left eye). (D) Visual field recorded with Tübingen static perimetry (right eye). (E) Trace array of 61 focal ERGs (left eye). (F) Trace array of 61 focal ERGs (right eye). (G) Plot of response density (left eye). (H) Plot of response density (right eye).
Figure 6
Figure 6
Case 3 both eyes. (A) Fundus photograph (left eye). (B) Fundus photograph (right eye). (C) Visual field recorded with Tübingen static perimetry (left eye). (D) Visual field recorded with Tübingen static perimetry (right eye). (E) Trace array of 61 focal ERGs (left eye). (F) Trace array of 61 focal ERGs (right eye). (G) Plot of response density (left eye). (H) Plot of response density (right eye).

References

    1. Nat Genet. 1997 Mar;15(3):236-46 - PubMed
    1. Ophthalmic Res. 1996;28(5):303-11 - PubMed
    1. Ger J Ophthalmol. 1996 Nov;5(6):399-403 - PubMed
    1. Am J Ophthalmol. 1967 Jul;64(1):3-23 - PubMed
    1. Arch Ophthalmol. 1976 Dec;94(12):2061-7 - PubMed

Publication types