. 1998 Jun 1;141(5):1181-91.
doi: 10.1083/jcb.141.5.1181.

Localization of Mad2 to kinetochores depends on microtubule attachment, not tension

Affiliations

Localization of Mad2 to kinetochores depends on microtubule attachment, not tension

J C Waters et al. J Cell Biol. .

Abstract

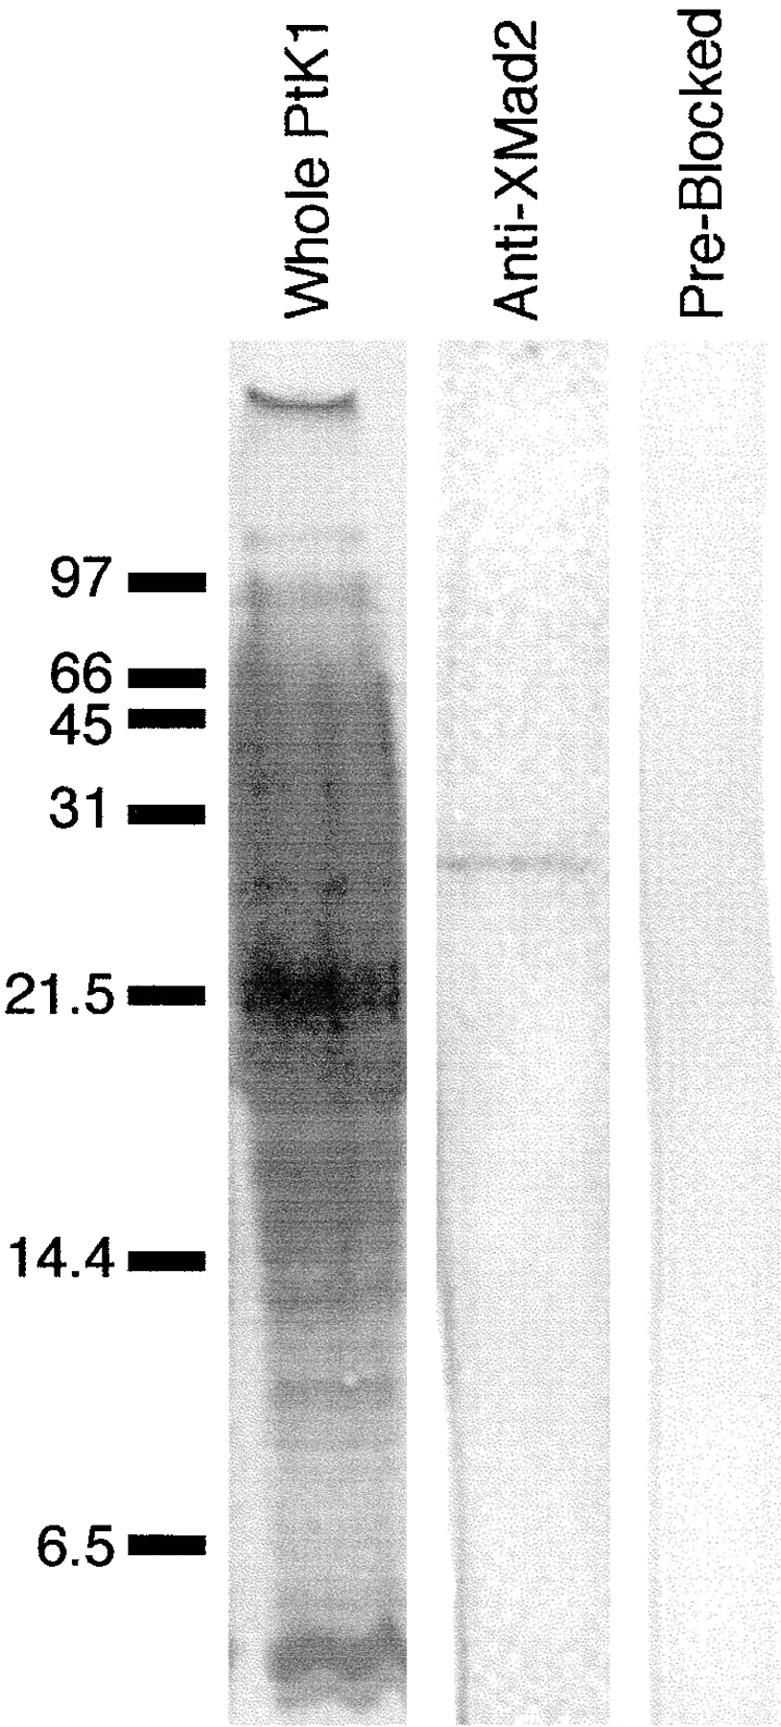
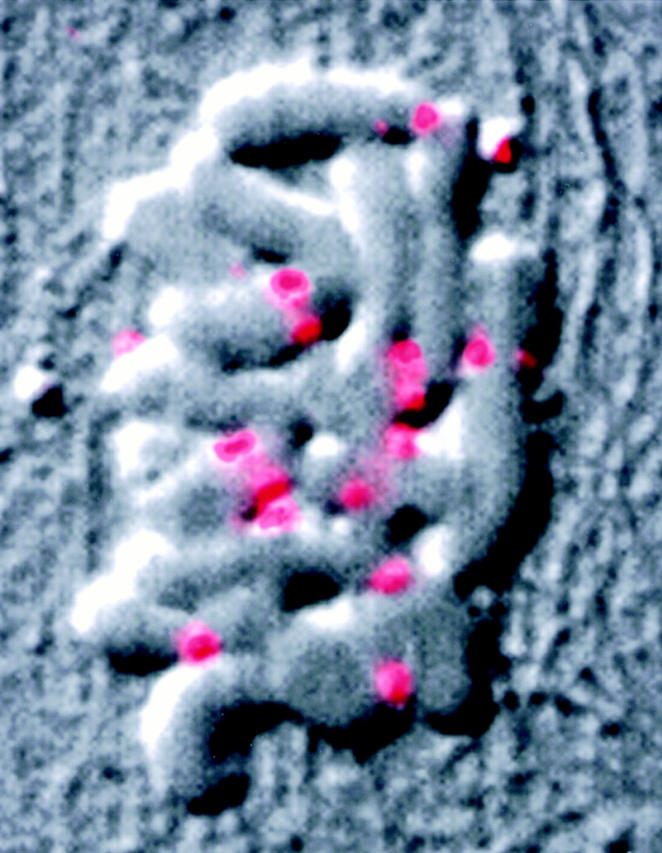
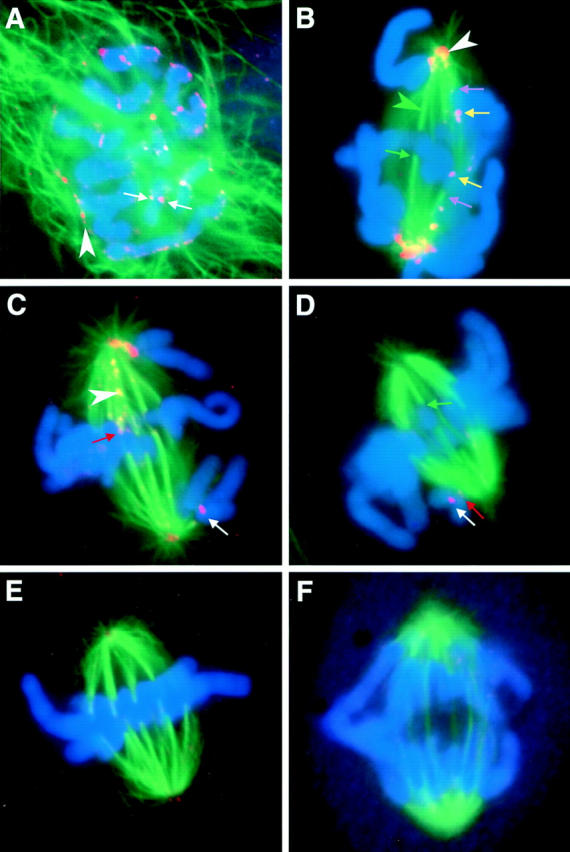
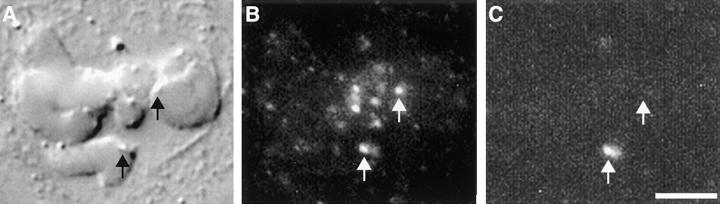
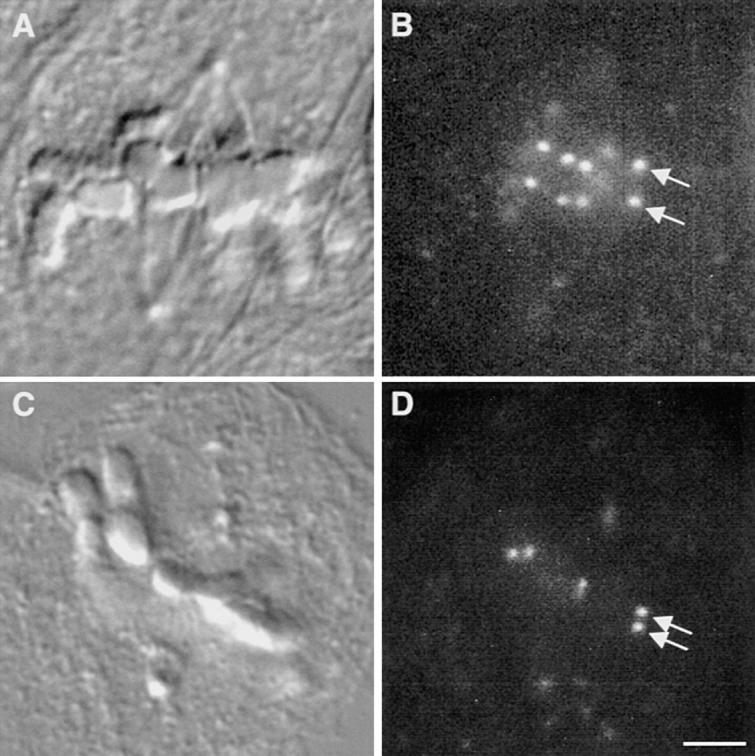
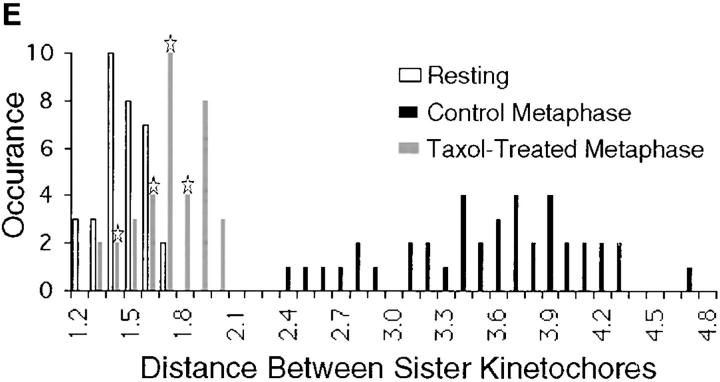
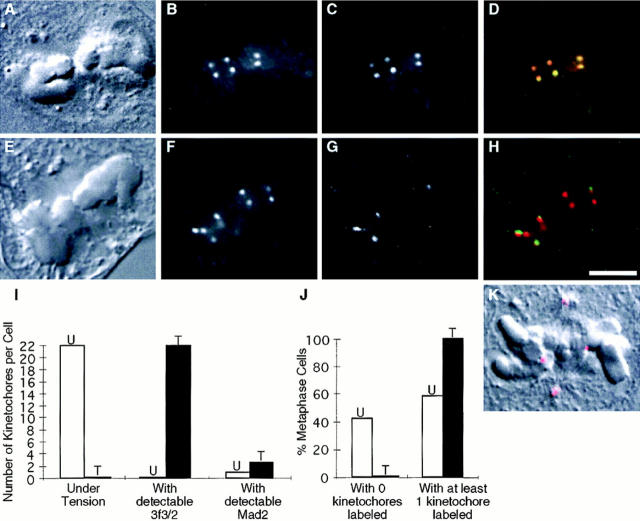
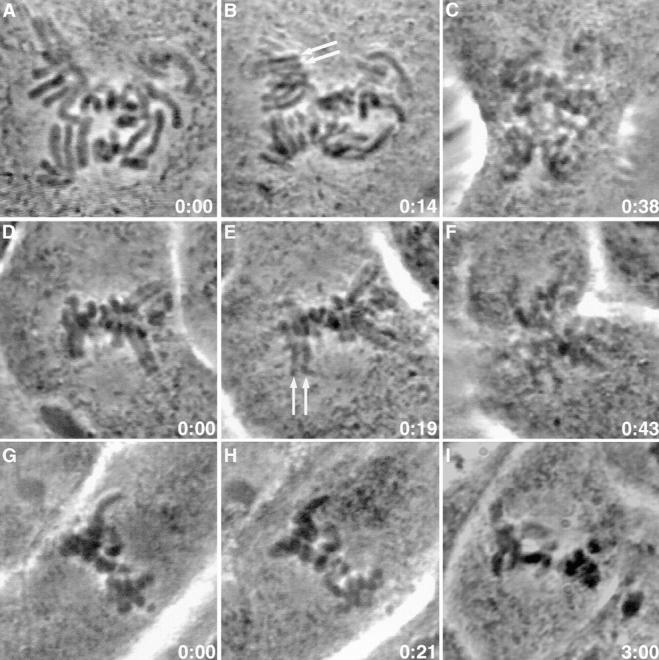
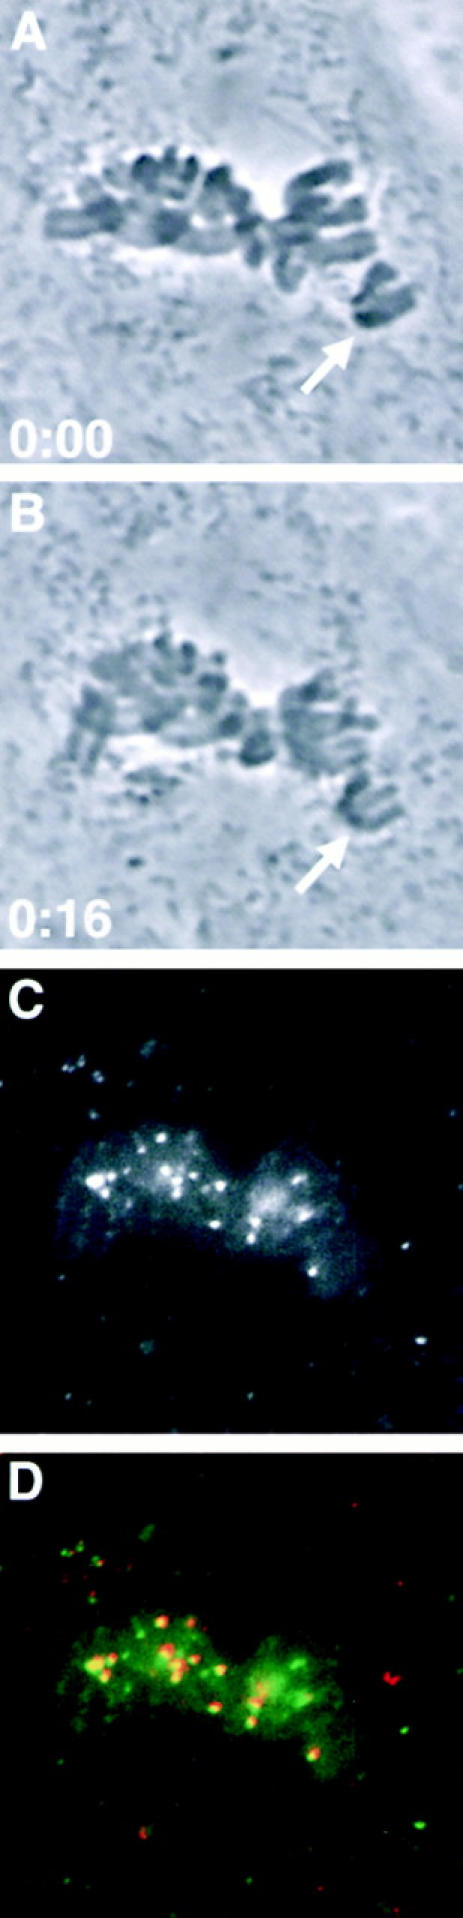
A single unattached kinetochore can delay anaphase onset in mitotic tissue culture cells (Rieder, C.L., A. Schultz, R. Cole, G. Sluder. 1994. J. Cell Biol. 127:1301-1310). Kinetochores in vertebrate cells contain multiple binding sites, and tension is generated at kinetochores after attachment to the plus ends of spindle microtubules. Checkpoint component Mad2 localizes selectively to unattached kinetochores (Chen, R.-H., J.C. Waters, E.D. Salmon, and A.W. Murray. 1996. Science. 274:242-246; Li, Y., and R. Benezra. Science. 274: 246-248) and disappears from kinetochores by late metaphase, when chromosomes are properly attached to the spindle. Here we show that Mad2 is lost from PtK1 cell kinetochores as they accumulate microtubules and re-binds previously attached kinetochores after microtubules are depolymerized with nocodazole. We also show that when kinetochore microtubules in metaphase cells are stabilized with taxol, tension at kinetochores is lost. The phosphoepitope 3f3/2, which has been shown to become dephosphorylated in response to tension at the kinetochore (Nicklas, R.B., S.C. Ward, and G.J. Gorbsky. 1995. J. Cell Biol. 130:929-939), is phosphorylated on all 22 kinetochores after tension is reduced with taxol. In contrast, Mad2 only localized to an average of 2.6 out of the 22 kinetochores in taxol-treated PtK1 cells. Therefore, loss of tension at kinetochores occupied by microtubules is insufficient to induce Mad2 to accumulate on kinetochores, whereas unattached kinetochores consistently bind Mad2. We also found that microinjecting antibodies against Mad2 caused cells arrested with taxol to exit mitosis after approximately 12 min, while uninjected cells remained in mitosis for at least 6 h, demonstrating that Mad2 is necessary for maintenance of the taxol-induced mitotic arrest. We conclude that kinetochore microtubule attachment stops the Mad2 interactions at kinetochores which are important for inhibiting anaphase onset.


Figures

Figure 1
Figure 1
Affinity-purified anti-XMad2 antibodies recognize one 24-kD band in PtK1 cells. Immunoblot analysis with the affinity-purified anti-XMad2 polyclonal antibodies. Left, middle, right lanes, whole PtK1 cell; left lane, Coomassie blue–stained Immobilon; middle lane, immunoblot with anti-XMad2 antibodies; right lane, immunoblot with anti-XMad2 antibodies that were pre-incubated with recombinant XMad2. Position of molecular weight markers are indicated on left.
Figure 2
Figure 2
Mad2 rebinds PtK1 kinetochores after microtubule depolymerization. This metaphase cell was treated with 20 μg/ml nocodazole for 20 min at 37°C before being fixed and processed for immunofluorescence. Coverslips were scribed before drug treatment to aid in subsequent identification of cells. Digital DIC (black and white) and Mad2 (pink/red) images were pseudocolored and overlaid. The majority of the 22 kinetochores are visible in this optical section.
Figure 4
Figure 4
Mad2 leaves kinetochores as they accumulate kinetochore microtubules. Mitotic PtK1 cells were labeled with antibodies to Mad2 (orange/pink), antibodies to α-tubulin (green), and the DNA stain Hoechst 33342 (blue). (A) Just after nuclear envelope breakdown. White arrows, Mad2 accumulating on kinetochores; white arrowhead, Mad2 on residual nuclear envelope. (B) Early prometaphase. Green arrowhead, kinetochore fibers are visible as bright dense bundles of green microtubules that end abruptly on a chromosome; white arrowhead, spindle pole. (C) Mid-prometaphase. White arrowhead, Mad2 on kinetochore microtubules. (D) Late prometaphase. (E) Metaphase. (F) Anaphase. Yellow arrows, newly attached leading kinetochores on congressing chromosomes label brightly for Mad2; purple arrows, trailing kinetochores on attached kinetochores label less brightly; green arrows, attached kinetochores that lack Mad2; and red arrows, attached kinetochores on which some Mad2 is still visible.
Figure 3
Figure 3
Mad2 leaves attached kinetochores. (A–C) Micrograph of a late prometaphase PtK1 cell with one mono-oriented chromosome. This cell was first lysed and extracted to rinse away cytoplasmic Mad2, and then microtubules were depolymerized. The cell was fixed and immunolabeled with CREST serum (B) and antibodies to Mad2 (C). (A) DIC image. (B) An immunofluorescence micrograph showing that kinetochores labeled normally with CREST serum after the treatment used to depolymerized microtubules after cell lysis. (C) An immunofluorescence micrograph showing Mad2 localization. Mad2 is found at the kinetochore that was unattached before treatment (bottom arrow), but is not present on previously attached kinetochores (top arrow). This demonstrates that Mad2 is not simply masked by microtubules bound to the kinetochore, but is lost after microtubule attachment. Bar, 5 μm.
Figure 5
Figure 5
Tension at PtK1 metaphase cell kinetochores is reduced after treatment with 10 μM taxol. (A) A DIC micrograph of a control metaphase PtK1 cell. (B) A fluorescence micrograph of the same cell shown in A, showing kinetochores labeled with CREST serum. A pair of sister kinetochores are labeled with arrows. (C) A DIC micrograph of a metaphase PtK1 cell that was incubated in 10 μM taxol for 45 min before fixation. (D) A fluorescence micrograph of the same cell shown in C, showing kinetochores labeled with CREST serum. A pair of sister kinetochores are labeled with arrows. The distance between sister kinetochores in taxol-treated metaphase cells is shorter than in control cells. (E) A histogram depicting the distribution of distances between sister kinetochores in prophase, control metaphase, and taxol-treated metaphase cells. Sister kinetochores in prophase cells are “resting” (white). After sister kinetochores become properly attached to the spindle, net poleward forces stretch the centromere and generate tension on kinetochores (black). Taxol relieves this tension, decreasing the distance between sister kinetochores (gray). Stars over black bars indicate the distances measured between those sister kinetochore pairs in which Mad2 localized to one or both of the sisters (see Fig. 6; average = 1.7; n = 10). Bar, 10 μm.
Figure 5
Figure 5
Tension at PtK1 metaphase cell kinetochores is reduced after treatment with 10 μM taxol. (A) A DIC micrograph of a control metaphase PtK1 cell. (B) A fluorescence micrograph of the same cell shown in A, showing kinetochores labeled with CREST serum. A pair of sister kinetochores are labeled with arrows. (C) A DIC micrograph of a metaphase PtK1 cell that was incubated in 10 μM taxol for 45 min before fixation. (D) A fluorescence micrograph of the same cell shown in C, showing kinetochores labeled with CREST serum. A pair of sister kinetochores are labeled with arrows. The distance between sister kinetochores in taxol-treated metaphase cells is shorter than in control cells. (E) A histogram depicting the distribution of distances between sister kinetochores in prophase, control metaphase, and taxol-treated metaphase cells. Sister kinetochores in prophase cells are “resting” (white). After sister kinetochores become properly attached to the spindle, net poleward forces stretch the centromere and generate tension on kinetochores (black). Taxol relieves this tension, decreasing the distance between sister kinetochores (gray). Stars over black bars indicate the distances measured between those sister kinetochore pairs in which Mad2 localized to one or both of the sisters (see Fig. 6; average = 1.7; n = 10). Bar, 10 μm.
Figure 6
Figure 6
A comparison of 3f3/2 phosphorylation and Mad2 localization at kinetochores after taxol treatment. (A–H) Metaphase PtK1 cells treated with 10 μM taxol for 45 min before fixation. (A–D) A cell that was immunolabeled with CREST serum (B) and antibodies to the 3F3/2 phosphoepitope (C). (E-H) Cells that were immunolabeled with CREST serum (F) and antibodies to Mad2 (G). DIC images are shown in A and E, and digital color overlays of CREST (red) and Mad2 (H; green) or 3f3/2 (D; green) are shown. After taxol treatment, the 3F3/2 epitope is phosphorylated on all metaphase kinetochores (C and D), while Mad2 is found on some but not all kinetochores (G and H). (I) A histogram comparing the number of kinetochores under tension with 3f3/2 phosphorylation and Mad2 localization to kinetochores in untreated (white, U) and taxol-treated (10 μM for 45 min; black, T) metaphase cells. In untreated cells, all 22 kinetochores were under tension. Taxol treatment reduced tension at all kinetochores. Consistent with this, 3f3/2 was not phosphorylated on any kinetochores in untreated metaphase cells, but became rephosphorylated after tension was reduced with taxol. If Mad2 also responds to differences in tension at kinetochores, we would expect Mad2 to localize to all kinetochores after tension is reduced at all kinetochores with taxol. However, Mad2 only localized to an average of 2.6 kinetochores per metaphase cell after taxol treatment. (J) A histogram comparing the percentages of untreated and taxol-treated (10 μM for 45 min) metaphase cells that have no Mad2 on any kinetochores and that have Mad2 on at least one kinetochore. 42% of untreated metaphase cells had no detectable Mad2 labeling on any kinetochores. Presumably, these cells were close to anaphase onset. In the remaining 58%, Mad2 localized to at least one kinetochore. In contrast, Mad2 localized to at least one kinetochore in every taxol-treated cell we examined. This not only explains the slight increase in average number of kinetochores labeled with Mad2 after taxol-treatment, but it also demonstrates that there is a strong correlation between Mad2 localization to at least one kinetochore and the mitotic arrest. (K) A DIC (black and white) and Mad2 (red) overlay showing a metaphase PtK1 cell treated with 10 μM taxol for 3 h before fixation. Even after 3 h in taxol, Mad2 still localizes to at least one kinetochore.
Figure 7
Figure 7
Microinjection of Mad2 antibodies overcomes taxol-induced mitotic arrest. (A–I) Phase micrographs of PtK1 cells treated with 10 μM taxol for at least 45 min before microinjection. Time is shown in h:min after microinjection. (A) A taxol-treated prometaphase cell seconds before microinjection with antibodies to Mad2. (B) 14 min later, sister chromatids have visibly separated (arrows). (C) By 38 min, chromosomes are decondensing and cytokinesis has begun. (D) A taxol-treated metaphase cell seconds before microinjection with antibodies to Mad2. (E) 19 min later, sister chromatids have visibly separated (arrows). (F) By 43 min, chromosomes are decondensing and cytokinesis has begun. (G) A taxol-treated metaphase cell seconds before microinjection with antibodies to Mad2 that had been pre-blocked with antigen. (H and I) Even after 3 h, the cell is still arrested in mitosis.
Figure 8
Figure 8
Microinjected Mad2 antibodies localize to both attached and unattached kinetochores. Phase images of a prometaphase PtK1 cell treated with 10 μM taxol for 45 min before microinjection. Time is shown in h:min. (A) Seconds before microinjection with antibodies to Mad2. (B) 16 min later, sister chromatids have visibly separated (arrows in A and B). (C) Localization of microinjected antibodies to Mad2. (D) Microinjected antibodies to Mad2 (green) colocalize with kinetochores labeled with CREST serum (red).

Similar articles

Cited by

References

    1. Alexander SP, Rieder CL. Chromosome motion during attachment to the vertebrate spindle: Initial saltatory-like behavior of chromosomes and quantitative analysis of force production by nascent kinetochore fibers. J Cell Biol. 1991;113:805–815. - PMC - PubMed
    1. Brinkley BR, Cartwright J. Ultrastructural analysis of mitotic spindle elongation in mammalian cells in vitro: Direct microtubule counts. J Cell Biol. 1971;93:33–48. - PMC - PubMed
    1. Brues AM, Cohen A. Effects of colchicine and related substances on cell division. Biochem J. 1936;30:1363–1368. - PMC - PubMed
    1. Cassimeris L, Rieder CL, Rupp G, Salmon ED. Stability of microtubule attachment to metaphase kinetochores in PtK1 cells. J Cell Sci. 1990;96:9–15. - PubMed
    1. Campbell MS, Gorbsky GJ. Microinjection of mitotic cells with the 3F3/2 anti-phosphoepitope antibody delays the onset of anaphase. J Cell Biol. 1995;129:1195–1204. - PMC - PubMed

Publication types