. 1998 Jun 1;187(11):1799-811.
doi: 10.1084/jem.187.11.1799.

The serine proteinase inhibitor (serpin) plasminogen activation inhibitor type 2 protects against viral cytopathic effects by constitutive interferon alpha/beta priming

Affiliations

The serine proteinase inhibitor (serpin) plasminogen activation inhibitor type 2 protects against viral cytopathic effects by constitutive interferon alpha/beta priming

T M Antalis et al. J Exp Med. .

Abstract

The serine proteinase inhibitor (serpin) plasminogen activator inhibitor type 2 (PAI-2) is well characterized as an inhibitor of extracellular urokinase-type plasminogen activator. Here we show that intracellular, but not extracellular, PAI-2 protected cells from the rapid cytopathic effects of alphavirus infection. This protection did not appear to be related to an effect on apoptosis but was associated with a PAI-2-mediated induction of constitutive low-level interferon (IFN)-alpha/beta production and IFN-stimulated gene factor 3 (ISGF3) activation, which primed the cells for rapid induction of antiviral genes. This primed phenotype was associated with a rapid development of resistance to infection by the PAI-2 transfected cells and the establishment of a persistent productive infection. PAI-2 was also induced in macrophages in response to viral RNA suggesting that PAI-2 is a virus response gene. These observations, together with the recently demonstrated PAI-2-mediated inhibition of tumor necrosis factor-alpha induced apoptosis, (a) illustrate that PAI-2 has an additional and distinct function as an intracellular regulator of signal transduction pathway(s) and (b) demonstrate a novel activity for a eukaryotic serpin.


Figures

Figure 1
Figure 1
PAI-2–expressing HeLa cell lines are protected from the CPEs of some viruses. Each of the indicated HeLa cell lines were seeded into 96-well plates in duplicate at 2 × 10⁴ cells/well and were infected after 10–24 h with 10-fold serial dilutions of the indicated virus stock. S1a and S1b are PAI-2–expressing cell lines and A2/7, A2/17, CAT, and CMV are controls which do not express PAI-2 (see Materials and Methods). The multiplicity of infection (MOI) is expressed as a log value, thus log MOI of 0 represents 1 virus unit per cell (see Materials and Methods for different units) and log MOI -7 refers to seven 10-fold serial dilutions of log MOI 0. Cell survival was measured after 7 d by crystal violet assay and is expressed as percent survival relative to untreated cells.
Figure 2
Figure 2
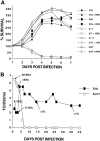
Cell survival and RRV infection in PAI-2–expressing and control HeLa cell lines. (A) Time course of cell survival. The survival of the panel of cell lines infected (dashed lines) or not infected (solid lines) with RRV was assayed daily in replicate plates using the MTT assay. RRV infection was at MOI = 1. (B) Time course of RRV infection. RRV replication (TCID50) and percentage of cells infected (estimated by indirect immunofluorescence on replicate cultures and indicated by % and arrow) was monitored for RRV-infected S1b and A2/7 cell lines. PAI-2–expressing (S1b) and nonexpressing (A2/7) cell lines were seeded into 24-well plates, 106 cells/well in duplicate, and infected at MOI = 1 for 90 min. Free virus was removed by five washes and at the indicated time points, 100 μl was removed for viral titer assay. Medium was changed every 3 d and S1b cultures were split 1 in 3 every 4–5 d after day 6.
Figure 3
Figure 3
Protein expression in S1b and A2/7 cell lines infected with RRV. PAI-2–expressing (S1b) and nonexpressing (A2/7) cell lines were seeded into 6-well plates (5 × 10⁶ cells/well in duplicate), infected at MOI = 1 for 90 min, and extracellular virus was removed by five washes. At the indicated times, the cells were harvested and protein extracts were electrophoretically separated by SDS-PAGE and immunoblotted. Identical blots were probed with antibodies directed against RRV proteins, PAI-2, and bcl-2 (see Materials and Methods). The RRV proteins are p95 (the capsid-E1-E2-E3 polyprotein); pE2 (pre-E2); E1 and E2 (the structural surface proteins of the virus); the capsid (which is cleaved from the capsid-E1-E2-E3 polyprotein); and E3, which does not become part of the final virion. Equal amounts of protein as determined by Bio-Rad protein assay were loaded in each lane and the blots were reprobed with anti–α-tubulin as a control for protein loading in each lane.
Figure 4
Figure 4
Extracellular PAI-2 was not implicated in protection against CPE. S1b and A2/7 cells were seeded into 96-well plates in duplicate at 2 × 10⁴ cells/ well. RRV (MOI = 1) was added where indicated and cells incubated at 37°C for 7 d before measurement of CPE by crystal violet assay. A2/7 cells were pretreated for 24 h with recombinant PAI-2 (8 μg/ml). S1b cells were incubated with uPA at 500 ng/ml for the 7-d CPE assay. Cell survival is expressed as percentage of survival relative to untreated cells.
Figure 5
Figure 5
The role of IFN-α/β. (A) Bioassay of IFN-α/β protein activity in the supernatants of S1b, A2/7, CAT, and parental HeLa cell lines. Cells were cultured for 24 h in the presence of medium alone, RRV (MOI = 1), or 20 μg/ml poly IC. Assays were performed in triplicate and error bars represent SD. (B) Assay by RT-PCR for IFN-α, IFN-β, and β actin mRNAs in S1b and A2/7 cells 24 h after treatment with medium alone (control), RRV (MOI = 1), or poly IC (20 μg/ml). As the PCR amplification efficiency is quite different for IFN-α and IFN-β mRNA transcripts, the different intensities for IFN-α and IFN-β amplification products do not necessarily demonstrate different relative levels of these two cytokines. (C) Transfer of supernatants from S1b cell and A2/7 cells onto A2/7 cells followed by infection with RRV. Neat (1×) or 15- or 30-fold concentrated 24-h supernatants from S1b and A2/7 were added to A2/7 cells overnight before infection with RRV (MOI = 1). Control represents addition of medium rather than supernatant followed by RRV infection. Cell survival was determined by crystal violet assay and is expressed as a percentage of A2/7 cells, which were incubated with medium and were not infected with RRV (NO RRV). (Supernatant alone in the absence of RRV had no significant effect on cell survival; data not shown). (D) Long-term incubation of S1b cells with anti–IFN-α and anti–IFN-β antibodies. S1b cells were maintained at low cell density in the presence of anti–IFN-α/β antibodies (anti–IFN-αβ + RRV) or control antibody (control antibody + RRV) for the indicated number of days (gray bars, day 2; hatched bars, day 18; black bars, day 25) followed by infection with RRV; MOI = 1. S1b cells were also incubated with anti–IFN-α/β antibodies without RRV infection (anti–IFN-α/β NO RRV). Cell survival was measured on day 6 using the crystal violet assay and was expressed as a percentage of the survival of cells that had been incubated with control antibody and that had not been infected with RRV.
Figure 5
Figure 5
The role of IFN-α/β. (A) Bioassay of IFN-α/β protein activity in the supernatants of S1b, A2/7, CAT, and parental HeLa cell lines. Cells were cultured for 24 h in the presence of medium alone, RRV (MOI = 1), or 20 μg/ml poly IC. Assays were performed in triplicate and error bars represent SD. (B) Assay by RT-PCR for IFN-α, IFN-β, and β actin mRNAs in S1b and A2/7 cells 24 h after treatment with medium alone (control), RRV (MOI = 1), or poly IC (20 μg/ml). As the PCR amplification efficiency is quite different for IFN-α and IFN-β mRNA transcripts, the different intensities for IFN-α and IFN-β amplification products do not necessarily demonstrate different relative levels of these two cytokines. (C) Transfer of supernatants from S1b cell and A2/7 cells onto A2/7 cells followed by infection with RRV. Neat (1×) or 15- or 30-fold concentrated 24-h supernatants from S1b and A2/7 were added to A2/7 cells overnight before infection with RRV (MOI = 1). Control represents addition of medium rather than supernatant followed by RRV infection. Cell survival was determined by crystal violet assay and is expressed as a percentage of A2/7 cells, which were incubated with medium and were not infected with RRV (NO RRV). (Supernatant alone in the absence of RRV had no significant effect on cell survival; data not shown). (D) Long-term incubation of S1b cells with anti–IFN-α and anti–IFN-β antibodies. S1b cells were maintained at low cell density in the presence of anti–IFN-α/β antibodies (anti–IFN-αβ + RRV) or control antibody (control antibody + RRV) for the indicated number of days (gray bars, day 2; hatched bars, day 18; black bars, day 25) followed by infection with RRV; MOI = 1. S1b cells were also incubated with anti–IFN-α/β antibodies without RRV infection (anti–IFN-α/β NO RRV). Cell survival was measured on day 6 using the crystal violet assay and was expressed as a percentage of the survival of cells that had been incubated with control antibody and that had not been infected with RRV.
Figure 6
Figure 6
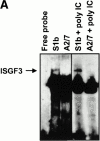
(A) EMSA assay for ISGF3. Nuclear extracts isolated from S1b and A2/7 cells, either untreated or treated with 20 μg/ml poly IC as indicated, were analyzed by EMSA using a radiolabeled ISRE oligonucleotide probe. The ISGF3 complex detected in S1b cells is indicated by the arrow. Free probe is shown at the bottom of the gel. The identity of ISGF3 was confirmed by immunoreactivity of this band with anti-ISGF3γ antibody (data not shown). (B) ISGF3γ and IRF-1 expression in S1b and A2/7 cells. Nuclear and cytoplasmic extracts from S1b and A2/7 cells were analyzed by immunoblotting using antibodies against ISGF3γ and IRF-1. Where indicated, cells were pretreated for 16 h with 500 U/ ml IFN-γ. Equal amounts of protein as determined by Bio-Rad protein assay were loaded in each lane.
Figure 6
Figure 6
(A) EMSA assay for ISGF3. Nuclear extracts isolated from S1b and A2/7 cells, either untreated or treated with 20 μg/ml poly IC as indicated, were analyzed by EMSA using a radiolabeled ISRE oligonucleotide probe. The ISGF3 complex detected in S1b cells is indicated by the arrow. Free probe is shown at the bottom of the gel. The identity of ISGF3 was confirmed by immunoreactivity of this band with anti-ISGF3γ antibody (data not shown). (B) ISGF3γ and IRF-1 expression in S1b and A2/7 cells. Nuclear and cytoplasmic extracts from S1b and A2/7 cells were analyzed by immunoblotting using antibodies against ISGF3γ and IRF-1. Where indicated, cells were pretreated for 16 h with 500 U/ ml IFN-γ. Equal amounts of protein as determined by Bio-Rad protein assay were loaded in each lane.
Figure 7
Figure 7
Induction of 2′-5′-OAS mRNA in S1b and A2/7 cells after RRV infection. (A) S1b and A2/7 cells (107 cells) were infected with RRV (MOI = 1) for the times indicated. Total RNA was isolated and analyzed by Northern blot using a 32P-radiolabeled OAS cDNA probe. OAS mRNA is present as at least three species of 3.6, 1.85, and 1.65 kb as previously described (23). The lower panel represents the level of 18S rRNA present in each lane as a control for loading. (B) Plot of the intensity of the OAS signal in each lane divided by the intensity of the 18S rRNA in the same sample.
Figure 7
Figure 7
Induction of 2′-5′-OAS mRNA in S1b and A2/7 cells after RRV infection. (A) S1b and A2/7 cells (107 cells) were infected with RRV (MOI = 1) for the times indicated. Total RNA was isolated and analyzed by Northern blot using a 32P-radiolabeled OAS cDNA probe. OAS mRNA is present as at least three species of 3.6, 1.85, and 1.65 kb as previously described (23). The lower panel represents the level of 18S rRNA present in each lane as a control for loading. (B) Plot of the intensity of the OAS signal in each lane divided by the intensity of the 18S rRNA in the same sample.
Figure 8
Figure 8
Induction of PAI-2 mRNA in human macrophage MonoMac6 cells by viral RNA. Total RNA was isolated from ∼107 MonoMac6 cells after exposure for 4 h to the following: lane 1, untreated; lane 2, ultraviolet irradiated, inactivated RRV plus Ab−1; lane 3, RRV infection; lane 4, RRV plus Ab−1; lane 5, RRV plus Ab−2; lane 6, RRV plus Ab−3; lane 7, RRV plus Ab−4; lane 8, 1 μg/ml LPS; lane 9, 40ng/ml PMA; lane 10, 20 μg/ml poly IC. RRV infection was performed at MOI = 1. RNA was analyzed by Northern blot using a 32P-labeled probe derived from PAI-2 cDNA. The lower panel represents the level of 18S rRNA present in each lane as a control for loading.

Similar articles

Cited by

References

    1. Remold-O'Donnell E. The ovalbumin family of serpin proteins. FEBS Lett. 1993;315:105–108. - PubMed
    1. Ray CA, Black RA, Kronheim SR, Greenstreet TA, Sleath PR, Salvesen GS, Pickup DJ. Viral inhibition of inflammation: cowpox virus encodes an inhibitor of the interleukin-1β converting enzyme. Cell. 1992;69:597–604. - PubMed
    1. Antalis TM, Clark MA, Barnes T, Lehrbach PR, Devine PL, Schevzov G, Goss NH, Stephens RW, Tolstoshev P. Cloning and expression of a cDNA coding for a human monocyte-derived plasminogen activator inhibitor. Proc Natl Acad Sci USA. 1988;85:985–989. - PMC - PubMed
    1. Zou Z, Anisowicz A, Hendrix MJC, Thor A, Neveu M, Sheng S, Rafidi K, Seftor E, Sager R. Maspin, a serpin with tumor-suppressing activity in human mammary epithelial cells. Science. 1994;263:526–529. - PubMed
    1. Scott FL, Coughlin PB, Bird C, Cerruti L, Hayman JA, Bird P. Protease inhibitor 6 cannot be secreted, which suggests it's a new type of cellular serpin. J Biol Chem. 1996;271:1605–1612. - PubMed

Publication types

MeSH terms