. 1998 Jun 1;187(11):1813-23.
doi: 10.1084/jem.187.11.1813.

An alternate pathway for T cell development supported by the bone marrow microenvironment: recapitulation of thymic maturation

Affiliations

An alternate pathway for T cell development supported by the bone marrow microenvironment: recapitulation of thymic maturation

M E García-Ojeda et al. J Exp Med. .

Abstract

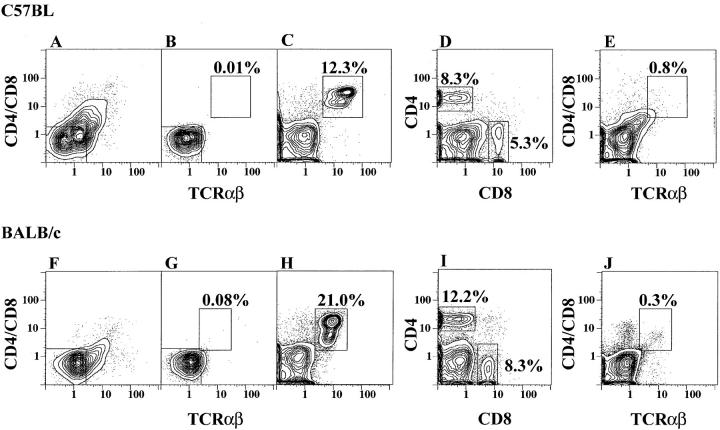
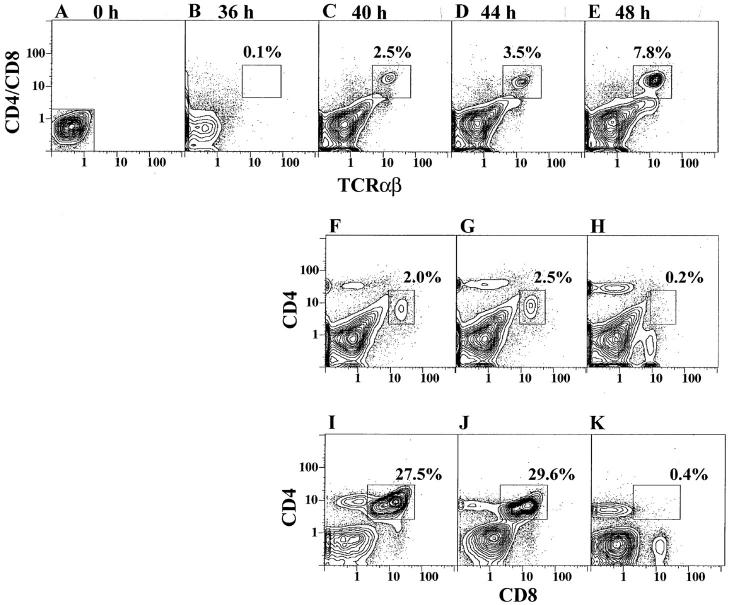
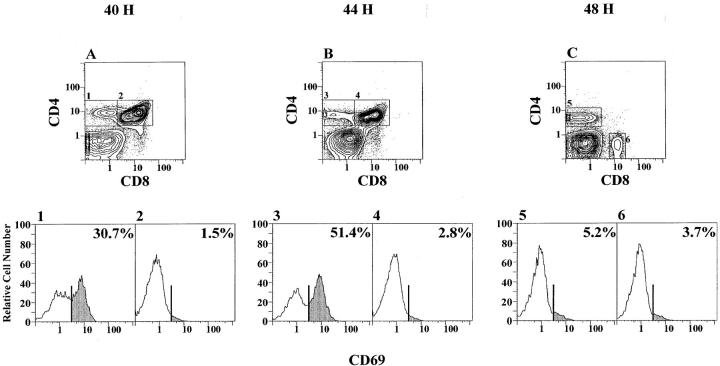
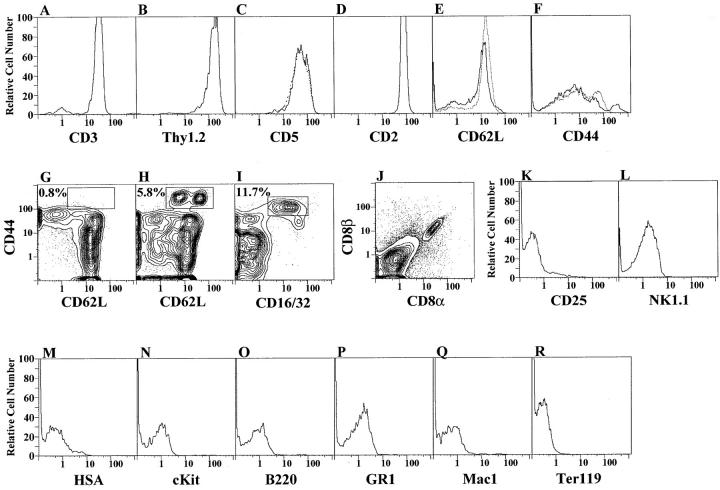
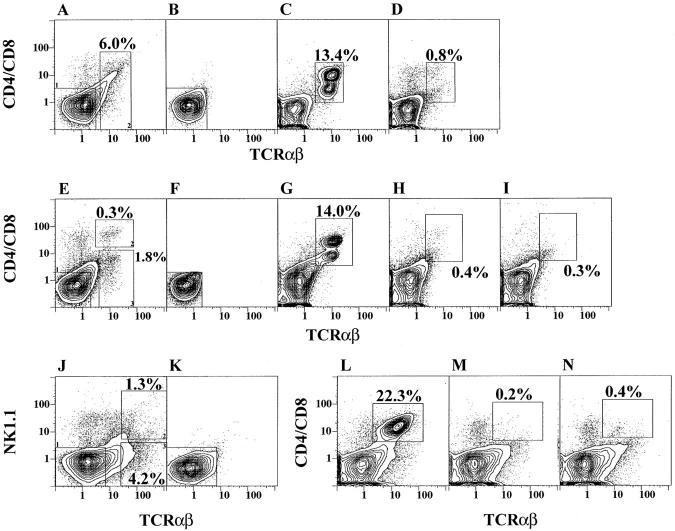
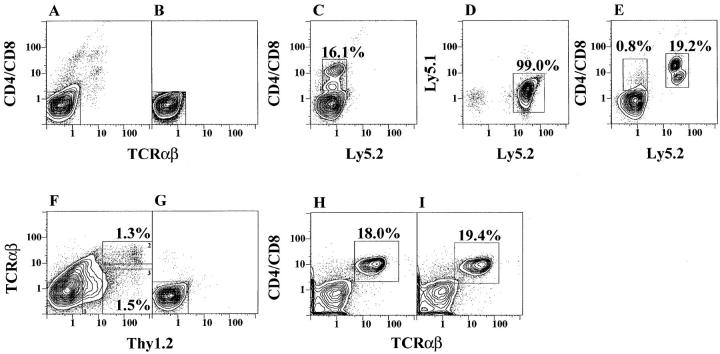
In the principal pathway of alpha/beta T cell maturation, T cell precursors from the bone marrow migrate to the thymus and proceed through several well-characterized developmental stages into mature CD4+ and CD8+ T cells. This study demonstrates an alternative pathway in which the bone marrow microenvironment also supports the differentiation of T cell precursors into CD4+ and CD8+ T cells. The marrow pathway recapitulates developmental stages of thymic maturation including a CD4+CD8+ intermediary cell and positive and negative selection, and is strongly inhibited by the presence of mature T cells. The contribution of the marrow pathway in vivo requires further study in mice with normal and deficient thymic or immune function.


Figures

Figure 1
Figure 1
CD4, CD8, and TCR-α/β profiles of bone marrow cells before and after culture. Freshly isolated bone marrow cells from C57BL/Ka (A) or BALB/c (F) mice were depleted of cells expressing CD4, CD8, and TCR-α/β markers using the gating boxes in the lower left and reanalyzed in B and G. The depleted marrow cells were cultured for 48 h and the bright TCR-α/β+ cells that developed are enclosed in the boxes in C and H. The depleted cultured cells were analyzed for CD4 versus CD8 markers in D and I. Analyses of non–T cell–depleted marrow cells after culture are shown in E and J.
Figure 2
Figure 2
Kinetics of development of CD4+CD8+, CD4+, and CD8+ T cells during marrow cultures. C57BL/Ka marrow cells depleted of α/β T cells (A) were cultured, and the CD4/CD8 versus TCR-α/β profiles are shown at 36 (B), 40 (C), 44 (D), and 48 (E) h. Boxes enclose the newly generated T cells. Analyses of CD4 versus CD8 markers are shown in the same cultures for 40 (F), 44 (G), and 48 (H) h, and boxes enclose CD4+CD8+ T cells. A repeat experiment is shown at 40 (I), 44 (J), and 48 (K) h.
Figure 3
Figure 3
Changes in the expression of CD69 on T cell subsets during marrow cultures. C57BL/Ka marrow cells were depleted of α/β T cells and cultured for 40 (A), 44 (B), and 48 (C) h as was shown in Fig. 2, F–H. Gated CD4+CD8med or CD4+CD8 cells (boxes 1, 3, and 5) or CD4+ CD8+ cells (boxes 2 and 4) or CD4CD8+ cells (box 6) were analyzed for the expression of CD69. The profiles and percentages of CD69+ cells in each box are shown in corresponding panels 1–6. Shaded areas show the CD69+ cells.
Figure 4
Figure 4
Surface markers on CD4+ and CD8+ T cells harvested at 48 h from C57BL/Ka marrow cultures. After gating of α/β+ cells, single color profiles for CD3, Thy1.2, CD5, CD2, CD62L, and CD44 receptors are shown in A–F (solid lines). Normal spleen T cell profiles are shown for comparison in C, E, and F (broken lines). Two-color profiles for CD44 versus CD62L receptors on gated normal spleen cells and on gated marrow-cultured cells are compared in G and H, respectively. In addition, the profile for CD44 versus CD16 on gated marrow cultured cells is shown in I. A two-color profile for CD8α versus CD8β receptors on α/β+-gated marrow cultured cells is shown in J. One-color profiles for CD25, NK1.1, HSA, cKit, B220, Gr-1, Mac-1, and Ter119 markers on α/β+-gated marrow-cultured cells are shown in K–R.
Figure 5
Figure 5
Add back of marrow T cells to T cell–depleted marrow cultures. Freshly isolated marrow cells (A) were sorted using the gating boxes 1 and 2, and reanalysis of T-depleted cells in box 1 are shown in B. After 48 h of culture of cells in B, newly formed T cells are enclosed in the box in C. Culture of combined cells from boxes 1 and 2 are shown in D. Marrow cells were also sorted for CD4+ or CD8+ TCR-α/β+ (E, box 2), or CD4CD8 TCR-α/β+ (E, box 3) T cells. F and G show T cell-depleted marrow cells before and after culture. H and I show T cell-depleted marrow cells cultured in combination with cells from E, box 2 or 3, respectively. Marrow cells were also gated for NK1.1 TCR-α/β (  J, box 1), NK1.1+ TCR-α/β+ (  J, box 2), and NK1.1TCR-α/β+ (  J, box 3) subsets, respectively. Sorted NK1.1TCR-α/β+ (K) cells were cultured alone (L), or with cells from box 2 (M) or box 3 (N).
Figure 6
Figure 6
Addition of lymph node T cells or Thy1.2+α/β marrow cells to marrow cultures. Freshly isolated marrow cells from Ly5.1 congenic mice were depleted of T cells by sorting (A and B), and profiles of CD4/CD8 versus Ly5.2 markers are shown after culture (C). The Ly5.1 versus 5.2 profile of lymph node cells from Ly5.2 congenic mice after gating on TCR-α/β+ cells is shown in D. Gated TCR-α/β+ cells from D were added to T-depleted marrow cells (B) and cultured for 48 h (E). CD4+ and CD8+ T cells that are Ly5.2 or Ly5.2+ are enclosed in left and right boxes, respectively. The profile of TCR-α/β versus Thy1.2 markers on C57BL/Ka marrow is shown in F, and sorted Thy1.2 TCR-α/β cells were reanalyzed (G). Cells from G were cultured alone and analyzed (H) or cultured in combination with Thy1.2+ TCR-α/β cells (I).

Similar articles

Cited by

References

    1. Adkins B, Mueller C, Okada CY, Reichert RA, Weissman IL, Spangrude GJ. Early events in T-cell maturation. Annu Rev Immunol. 1987;5:325–365. - PubMed
    1. Weissman IL. Developmental switches in the immune system. Cell. 1994;76:207–218. - PubMed
    1. Shortman K. Cellular aspects of early T-cell development. Curr Opin Immunol. 1992;4:140–146. - PubMed
    1. Antica M, Wu L, Shortman K, Scollay R. Intrathymic lymphoid precursor cells during fetal thymus development. J Immunol. 1993;151:5887–5895. - PubMed
    1. Ismaili J, Antica M, Wu L. CD4 and CD8 expression and T cell antigen receptor gene rearrangement in early intrathymic precursor cells. Eur J Immunol. 1996;26:731–737. - PubMed

Publication types

Substances