. 1998 Jun;111(6):825-46.
doi: 10.1085/jgp.111.6.825.

Electrophysiological characterization of the rat epithelial Na+ channel (rENaC) expressed in MDCK cells. Effects of Na+ and Ca2+

Affiliations

Electrophysiological characterization of the rat epithelial Na+ channel (rENaC) expressed in MDCK cells. Effects of Na+ and Ca2+

T Ishikawa et al. J Gen Physiol. 1998 Jun.

Abstract

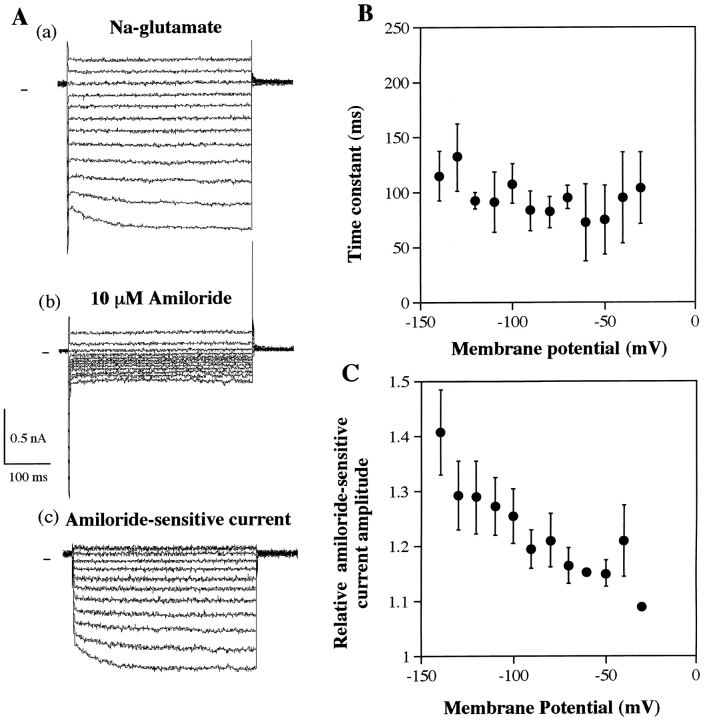
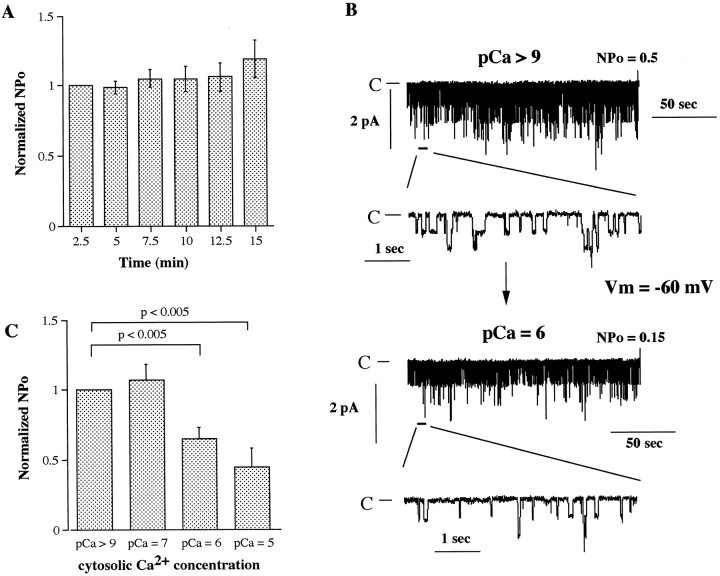
The epithelial Na+ channel (ENaC), composed of three subunits (alpha, beta, and gamma), is expressed in several epithelia and plays a critical role in salt and water balance and in the regulation of blood pressure. Little is known, however, about the electrophysiological properties of this cloned channel when expressed in epithelial cells. Using whole-cell and single channel current recording techniques, we have now characterized the rat alpha beta gamma ENaC (rENaC) stably transfected and expressed in Madin-Darby canine kidney (MDCK) cells. Under whole-cell patch-clamp configuration, the alpha beta gamma rENaC-expressing MDCK cells exhibited greater whole cell Na+ current at -143 mV (-1,466.2 +/- 297.5 pA) than did untransfected cells (-47.6 +/- 10.7 pA). This conductance was completely and reversibly inhibited by 10 microM amiloride, with a Ki of 20 nM at a membrane potential of -103 mV; the amiloride inhibition was slightly voltage dependent. Amiloride-sensitive whole-cell current of MDCK cells expressing alpha beta or alpha gamma subunits alone was -115.2 +/- 41.4 pA and -52.1 +/- 24.5 pA at -143 mV, respectively, similar to the whole-cell Na+ current of untransfected cells. Relaxation analysis of the amiloride-sensitive current after voltage steps suggested that the channels were activated by membrane hyperpolarization. Ion selectivity sequence of the Na+ conductance was Li+ > Na+ >> K+ = N-methyl-D-glucamine+ (NMDG+). Using excised outside-out patches, amiloride-sensitive single channel conductance, likely responsible for the macroscopic Na+ channel current, was found to be approximately 5 and 8 pS when Na+ and Li+ were used as a charge carrier, respectively. K+ conductance through the channel was undetectable. The channel activity, defined as a product of the number of active channel (n) and open probability (Po), was increased by membrane hyperpolarization. Both whole-cell Na+ current and conductance were saturated with increased extracellular Na+ concentrations, which likely resulted from saturation of the single channel conductance. The channel activity (nPo) was significantly decreased when cytosolic Na+ concentration was increased from 0 to 50 mM in inside-out patches. Whole-cell Na+ conductance (with Li+ as a charge carrier) was inhibited by the addition of ionomycin (microM) and Ca2+ (1 mM) to the bath. Dialysis of the cells with a pipette solution containing 1 microM Ca2+ caused a biphasic inhibition, with time constants of 1.7 +/- 0.3 min (n = 3) and 128.4 +/- 33.4 min (n = 3). An increase in cytosolic Ca2+ concentration from <1 nM to 1 microM was accompanied by a decrease in channel activity. Increasing cytosolic Ca2+ to 10 microM exhibited a pronounced inhibitory effect. Single channel conductance, however, was unchanged by increasing free Ca2+ concentrations from <1 nM to 10 microM. Collectively, these results provide the first characterization of rENaC heterologously expressed in a mammalian epithelial cell line, and provide evidence for channel regulation by cytosolic Na+ and Ca2+.


Figures

Figure 1
Figure 1
(A) Inward Na+ current amplitude at −143 mV measured in untransfected MDCK cells after overnight treatment with 2 mM butyrate and/or 1 μM dexamethasone. The Na+ current was measured by changing the bath solution from Na-glutamate-rich solution to a solution in which Na+ had been replaced by equimolar amounts of the impermeant NMDG+ cation. Values are mean ± SEM of six to eight experiments. (B, left) Comparison of whole-cell Na+ conductance in untransfected and αβγrENaC-(stably) transfected MDCK cells after overnight treatment with 2 mM butyrate and 1 μM dexamethasone. All the Na+ current in the αβγrENaC-transfected MDCK cells is amiloride sensitive, as shown in Fig. 2. Values are mean ± SEM of 8 and 14 experiments, respectively. (right) Amiloride (10 μM)-sensitive whole-cell currents in αβ- or αγrENaC stably transfected MDCK cells. Cells were treated overnight with 2 mM butyrate + 1 μM dexamethasone. Inward current amplitude was measured at −143 mV. Values are mean ± SEM of six experiments.
Figure 2
Figure 2
(A) Representative tracings of whole-cell currents obtained from αβγrENaC-expressing MDCK cells. The cell was held at a potential of +37 mV between test voltage pulses (−143 to +87 mV). The pipette was filled with a standard Cs-glutamate-rich solution. Whole-cell I-V relation was measured when the bath contained a Na-glutamate-rich solution (a), and then replacing the bath with a similar solution containing 10 μM amiloride (b), or with an NMDG-glutamate-rich solution (c). (B) Comparison of steady state I-V relation for the amiloride-sensitive whole-cell (○) and Na+ (□) currents. (C) Comparison of inward current amplitudes at −143 mV for the amiloride-sensitive Na+ and total Na+ currents.
Figure 3
Figure 3
Amiloride sensitivity of whole-cell Na+ currents in rENaC-expressing MDCK cells. (A) Representative tracings of the effect of different concentrations of amiloride obtained from a single MDCK cell. The pipette was filled with a standard Cs-glutamate-rich solution, and the bath contained a Na-glutamate-rich solution. The cell was held at a potential of +37 mV between test voltage pulses (−143 to +87 mV). (B) The corresponding I-V relations obtained from the same cell shown in A. (C) Dose-inhibition relation for the amiloride effect at −103 mV. Effect of different concentrations of amiloride (I/I 0) was normalized to a value in the presence of 1 μM amiloride. Data were fitted with Eq. 1 (see methods), where n′ = 0.8. Each point represents the mean ± SEM of two to five experiments. (D) Effect of membrane potential on the amiloride inhibition (at 0.1 μM) of the whole-cell current. Data were fitted with an equation derived from Eqs. 1 and 2 (see methods). Each point represents the mean of four experiments.
Figure 4
Figure 4
Voltage dependence of whole-cell Na+ conductance in rENaC-expressing MDCK cells. (A) An example of tracings of the whole-cell currents (a) before and (b) after the addition of amiloride (10 μM) to the bath solution. (c) Tracings of amiloride-sensitive currents obtained from a and b. Hyperpolarizing and depolarizing pulses 400 ms in duration were applied from a holding potential of +37 mV to potentials between −143 and +87 mV in 20-mV intervals. The pipette was filled with a Cs-glutamate-rich solution. Dependence of the relaxation time constant (B) and amiloride-sensitive current amplitude relative to that at +37 mV (C) on the membrane potential estimated from the whole-cell Na+-current induced by voltage pulses from a resting potential of +37 mV. The relative amiloride-sensitive current amplitude is defined as described in methods. Each point represents the mean ± SEM of four to six experiments.
Figure 5
Figure 5
(A) Whole-cell currents recorded from rENaC-expressing MDCK cells using a Na-glutamate-rich pipette solution. Bath solution was NMDG-glutamate-rich in the absence (a) or presence (b) of 10 μM amiloride. (c) Tracings of amiloride-sensitive currents obtained from a and b. Hyperpolarizing and depolarizing pulses 400 ms in duration were applied from a holding potential of −62 mV to potentials between −92 and +68 mV in 40-mV intervals. (B) The corresponding I-V relations of the whole-cell currents obtained from the same cell shown in A. (C) The corresponding I-V relation of amiloride-sensitive Na+ outward currents obtained from the same cell shown in A, c.
Figure 6
Figure 6
Ion selectivity of whole-cell Na+ conductance in rENaC-expressing MDCK cells. (A) Representative tracings of whole-cell currents recorded from rENaC-expressing MDCK cells in the presence of: (a) Na+, (b) Na+ plus 10 μM amiloride, (c) NMDG+, (d) K+, (e) Li+, or (f) Li+ plus 10 μM amiloride (150 mM of each cation as the glutamate salt in the bathing solution). The pipette solution was filled with a Cs-glutamate-rich solution. Hyperpolarizing and depolarizing pulses 400 ms in duration were applied from a holding potential of +37 mV to potentials between −143 and +87 mV in 10-mV intervals. (B) The corresponding I-V relations of the amiloride-sensitive Na+ and Li+ currents shown in A. (C) Comparison of amiloride (10 μM)- sensitive Na+ and Li+ currents at −143 mV. K+ currents were estimated by subtraction of whole-cell current in the presence of 150 mM K+ from that in the presence of 150 mM NMDG+. The amiloride-sensitive Na+ and Li+ currents were measured in the same cells. Data are the mean ± SEM of six experiments.
Figure 7
Figure 7
(A) Amiloride-sensitive single channel recorded in an outside-out patch from rENaC expressed in MDCK cells. The patch pipette was filled with Cs-glutamate solution and the bath contained Li-glutamate-rich solution. Application of amiloride (10 μM) to the bath solution abolished channel activity. Holding potential was −4 mV. (B) Current–voltage relation for the amiloride-sensitive single channel current in outside-out patches. The pipette was filled with a Cs-glutamate-rich solution and the bath contained a Li-glutamate-rich solution. Each point represents the mean ± SEM of nine experiments. (C) Single channel current traces from an outside-out patch in the presence of 150 mM Li+ or Na+ as the glutamate salt in the bathing solution. Holding potential was −4 mV.
Figure 8
Figure 8
Voltage dependence of single channel activity in inside-out patches. (A) Representative tracings of a single channel inward current at various membrane potentials, and (B) the corresponding I-V relation. (C) Summary of six different experiments where nP o was determined at various membrane potentials. Lines connect data obtained from the same patch. The pipette was filled with a Li-glutamate-rich solution, and the bath contained a K-glutamate-rich solution.
Figure 9
Figure 9
An ensemble analysis of single channel current in an excised inside-out patch. The pipette was filled with a Li-glutamate-rich solution and the bath solution was NMDG-glutamate rich. The membrane potential was held at +21 mV and then stepped to −139 mV. Top and middle traces represent the same current response to the voltage-step in different magnification. Lower trace represents the averaged current response when this voltage pulse was repeated 18 times.
Figure 10
Figure 10
Extracellular Na+ concentration dependency of the whole cell Na+ current. (A) Representative tracings of whole-cell currents from a single cell in the presence of increasing concentrations of extracellular Na+. The concentration was varied by equimolar replacement with NMDG+. (B) The I-V relations of whole-cell currents in different extracellular Na+ concentrations obtained for the same cell shown in A. (C) Plot of the inward Na+ current at −53 mV as a function of extracellular Na+ concentration. The current was normalized to the value at −143 mV. The data were fitted by the Michaelis-Menten equation (solid line). Each point represents the mean ± SEM of three to nine experiments. (D) Plot of the normalized whole-cell Na+ conductance as a function of extracellular Na+ concentration. The data were fitted by the Michaelis-Menten equation (solid line). Each point represents the mean ± SEM of three to nine experiments.
Figure 11
Figure 11
Na+ concentration dependency of the single channel conductance. (A) Extracellular Na+ concentration dependency of the single channel conductance of the inward current. A representative single channel recording in a cell-attached patch. The pipette solution was filled with a low (29 mM) Na+ solution and the bath solution contained 150 mM K-glutamate. Pipette potential was held at +160 mV. (B) Plot of single channel conductance of inward current as a function of Na+ concentrations in the pipette solution. The data were fitted by the Michaelis-Menten equation (solid line). Each point represents the mean ± SEM of three to eight experiments. Intracellular Na+ concentration dependency of the single channel conductance of the outward current: (C) current–voltage relation for single channel outward Na+ current in inside-out patches. The pipette solution was filled with a Cs-glutamate-rich solution and the bathing solution contained 150 mM Na-glutamate. Each point represents the mean ± SEM of nine experiments. (D) Intracellular Na+ concentration dependency of single channel conductance of outward current in excised inside-out patches. Single channel conductance of outward current is plotted as a function of Na+ concentrations in the bathing solution. The pipette solution was filled with a Cs-glutamate-rich solution and the bathing solution contained various concentrations of Na+. The data were fitted by the Michaelis-Menten equation (solid line). Each point represents the mean ± SEM of three to nine experiments, except the data of 50 mM Na+ (n = 1).
Figure 12
Figure 12
Effect of cytosolic Na+ concentration on single channel activity. (A and B) Representative tracings in an excised inside-out patch. The pipette was filled with a Li-glutamate-rich solution. (A) The effect of increasing cytosolic Na+ concentration from 0 to 50 mM, and (B) the effect of decreasing cytosolic Na+ concentration from 50 to 0 mM. Holding potentials were 0 and −30 mV, respectively. 1 mM EGTA was added to the bath solution to ensure low Ca2+ concentrations. (C) Summary of the effect of cytosolic Na+ concentration (50 mM) on single channel activity. Data were the mean ± SEM of seven or eight experiments. (D) Effect of increasing cytosolic Na+ concentration from 0 to 50 or 100 mM. Data were the mean ± SEM of four or eight experiments.
Figure 14
Figure 14
(A) Stability of Na+ channel activity in excised inside-out patches. Channel activity was estimated every 2.5 min for 15 min. Pipette solution was filled with Li-glutamate-rich solution and the bath solution contained NMDG-glutamate-rich solution with 1 mM EGTA. Data represent the mean ± SEM of nine experiments. (B) Representative experiment, where the effect of increasing cytosolic Ca2+ concentration on Na+ channel activity was examined in an excised inside-out patch. The pipette was filled with Li-glutamate-rich solution and the bath solution contained 150 mM K-glutamate. Holding potential was −64 mV. Cytosolic Ca2+ concentration was changed from <1 nM to 1 μM. (B) Representative compressed and expanded scale trace for both conditions. (C) Effect of cytosolic Ca2+ concentrations on channel activity. The nP o value was normalized to 1 with pCa > 9. Data for pCa = 7, 6, or 5 represent the mean ± SEM of four, eight, or eight experiments, respectively.
Figure 13
Figure 13
Effect of ionomycin on whole-cell current. (A) Instantaneous I-V relation of the whole-cell current obtained from a single MDCK cell expressing rENaC. Ramp command voltages were applied from −104 to +76 mV every 30 s. The pipette was filled with a Cs-glutamate-rich solution with 1 mM EGTA, and the bath solution contained Li-glutamate (nominally Ca2+ free). (B) An example of experiments in unstimulated cells. Ramp command voltages were applied from −104 to +76 mV every 30 s. (C) Summary of control experiments. t = 0 min corresponds to 3.9 ± 0.4 min (n = 9) after whole-cell dialysis. Each point represents the mean ± SEM of three to nine experiments. (D) Effect of the addition of ionomycin (1 μM) and 1 mM Ca2+ to the bath solution (nominally Ca2+ free). Experimental condition was the same as in A. Each point represents the mean ± SEM of three experiments. (E) The effect of cytoplasm perfusion with 1 μM Ca2+. Representative experiment, where the effect of 1 μM Ca2+ in the pipette solution on whole-cell current was examined. In this experiment, the current recording began 3 min after whole-cell dialysis. Ramp command voltages were applied from −104 to +76 mV every 30 s. When time course of the inhibition was fitted with a double exponential, the corresponding time constants of the two components were 1.3 and 64.3 min, respectively. The pipette was filled with a Cs-glutamate-rich solution (pCa = 6), and the bath solution contained Li-glutamate (nominally Ca2+ free).

Similar articles

Cited by

References

    1. Awayda MS, Ismailov II, Berdiev BK, Fuller CM, Benos DJ. Protein kinase regulation of a cloned epithelial Na+channel. J Gen Physiol. 1996;108:49–65. - PMC - PubMed
    1. Barry PH, Lynch JW. Liquid junction potentials and small cell effects in patch-clamp analysis. J Membr Biol. 1991;121:101–117. - PubMed
    1. Canessa CM, Horisberger J-D, Rossier BC. Epithelial sodium channel related to proteins involved in neurodegeneration. Nature. 1993;361:467–470. - PubMed
    1. Canessa CM, Schild L, Buell G, Thorens B, Gautschi I, Horisberger J-D, Rossier BC. Amiloride-sensitive epithelial Na+channel is made of three homologous subunits. Nature. 1994a;367:463–467. - PubMed
    1. Canessa CM, Mérillat A-M, Rossier BC. Membrane topology of the epithelial sodium channel in intact cells. Am J Physiol. 1994b;267:C1682–C1690. - PubMed

Publication types