

Effect of isovolaemic haemodilution on visual outcome in branch retinal vein occlusion
- PMID: 9613383
- PMCID: PMC1722474
- DOI: 10.1136/bjo.82.2.162
Effect of isovolaemic haemodilution on visual outcome in branch retinal vein occlusion
Abstract
Aims: To assess the efficacy of isovolaemic haemodilution therapy (IHT) in the treatment of patients with branch retinal vein occlusion (BRVO).
Methods: Patients presenting with BRVO between 1 July 1991 and 31 August 1993 were eligible for inclusion and randomised into treatment and control groups. Patients randomised to receive IHT were treated for 6 weeks with venesection and volume replacement using hydroxyethylstarch, a plasma expander. The target haematocrit was 35%. Follow up was for 1 year.
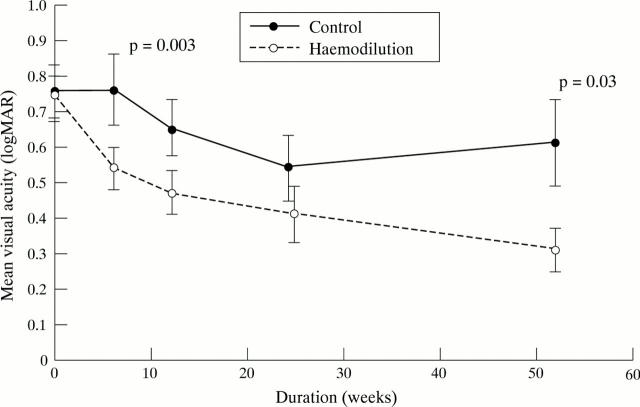
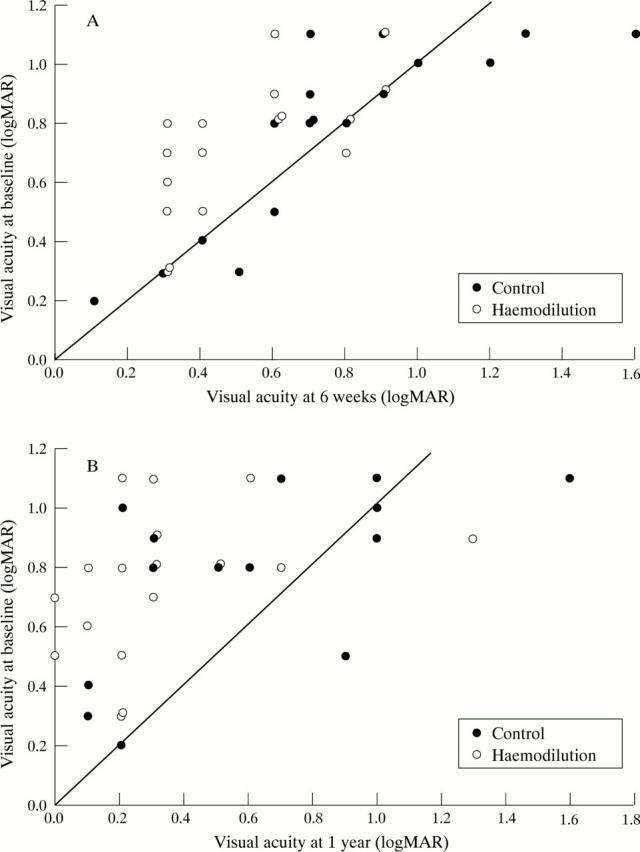
Results: The baseline visual acuity of the two groups was similar at 0.74 and 0.75 logMAR units (Snellen 6/36), for the IHT and control groups, respectively. At 6 weeks, visual acuity in the IHT group had improved by 0.20 logMAR units (2 lines on the Bailey-Lovie chart) (p = 0.0001). Vision was unchanged in the control group. At 1 year, the IHT group exhibited an improvement of 0.43 logMAR units. By comparison, the improvement in the control group at 1 year was significantly less at 0.17 logMAR units (p = 0.03). The final visual acuity in the IHT and control groups was 0.30 (Snellen 6/12) and 0.60 (Snellen 6/24) logMAR units, respectively.
Conclusions: The results support the theory that IHT has a positive effect on the visual outcome in patients with BRVO.
Figures
References
Publication types
MeSH terms
Substances
LinkOut - more resources
Full Text Sources