

Cumulative risk adjusted mortality chart for detecting changes in death rate: observational study of heart surgery
- PMID: 9614015
- PMCID: PMC28566
- DOI: 10.1136/bmj.316.7146.1697
Cumulative risk adjusted mortality chart for detecting changes in death rate: observational study of heart surgery
Erratum in
- BMJ 1998 Jun 27;316(7149):1947
Abstract
Objective: To detect changes in mortality after surgery, with allowance being made for variations in case mix.
Design: Observational study of postoperative mortality from January 1992 to August 1995.
Setting: Regional cardiothoracic unit.
Subjects: 3983 patients aged 16 and over who had open heart operations.
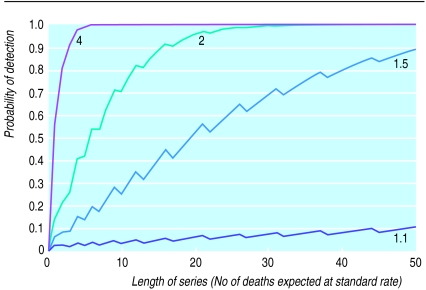
Main outcome measures: Preoperative risk factors and postoperative mortality in hospital within 30 days were recorded for all surgical heart operations. Mortality was adjusted for case mix using a preoperative estimate of risk based on additive Parsonnet factors. The number of operations required for statistical power to detect a doubling of mortality was examined, and control limits at a nominal significance level of P=0.01 for detection of an adverse trend were determined.
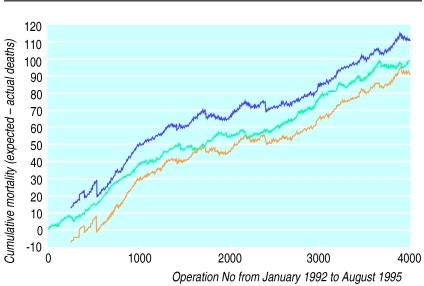
Results: Total mortality of 7.0% was 26% below the Parsonnet predictor (P<0.0001). There was a highly significant variation in annual case mix (Parsonnet scores 8.7-10.6, P<0.0001). There was no significant variation in mortality after adjustment for case mix (odds ratio 1-1.5, P=0.18) with monitoring by calendar year. With continuous monitoring, however, nominal 99% control limits based on 16 expected deaths were crossed on two occasions.
Conclusions: Hospital league tables for mortality from heart surgery will be of limited value because year to year differences in death rate can be large (odds ratio 1.5) even when the underlying risk or case mix does not change. Statistical quality control of a single series with adjustment for case mix is the only way to take into account recent performance when informing a patient of the risk of surgery at a particular hospital. If there is an increase in the number of deaths the chances of the next patient surviving surgery can be calculated from the last 16 deaths.
Figures
Comment in
-
Detection of changes in mortality after heart surgery. Control limits failed to account for case mix.BMJ. 1998 Nov 21;317(7170):1453. doi: 10.1136/bmj.317.7170.1453. BMJ. 1998. PMID: 9822413 Free PMC article. No abstract available.
References
-
- de Leval MR, Francois K, Bull C, Brawn W, Spiegelhalter D. Analysis of a cluster of surgical failures. Application to a series of neonatal arterial switch operations. J Thorac Cardiovasc Surg. 1994;107:914–924. - PubMed
-
- de Leval M. Human factors and surgical outcomes: a Cartesian dream. Lancet. 1997;349:723–725. - PubMed
-
- Rees-Mogg W. Why did they allow so many to die? Times 1996 Apr 1:16 (cols3-7).
-
- Rockall TA, Logan RF, Devlin HB, Northfield TC. Variation in outcome after acute upper gastrointestinal haemorrhage. Lancet. 1995;346:346–350. - PubMed
MeSH terms
LinkOut - more resources
Full Text Sources
Medical