. 1998 Jun;9(6):1293-308.
doi: 10.1091/mbc.9.6.1293.

The UNI3 gene is required for assembly of basal bodies of Chlamydomonas and encodes delta-tubulin, a new member of the tubulin superfamily

Affiliations
Free PMC article

The UNI3 gene is required for assembly of basal bodies of Chlamydomonas and encodes delta-tubulin, a new member of the tubulin superfamily

S K Dutcher et al. Mol Biol Cell. 1998 Jun.
Free PMC article

Abstract

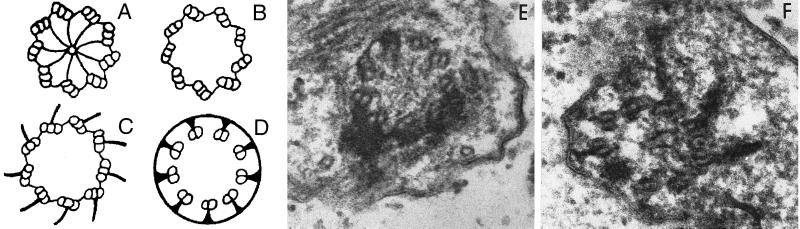
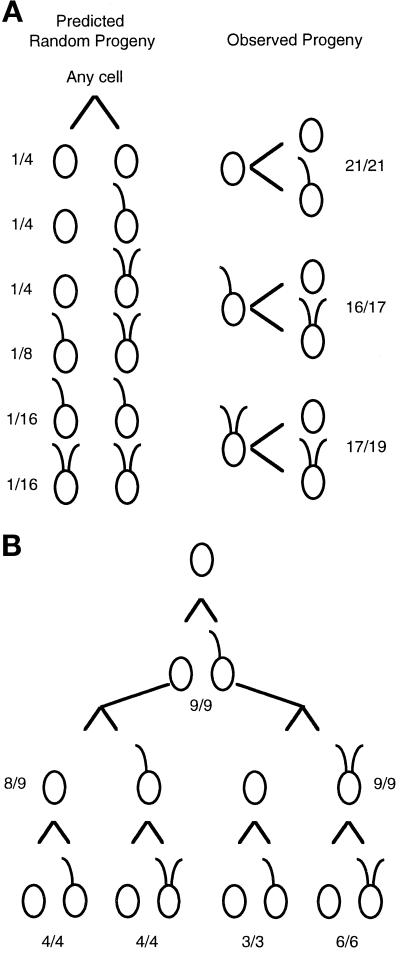
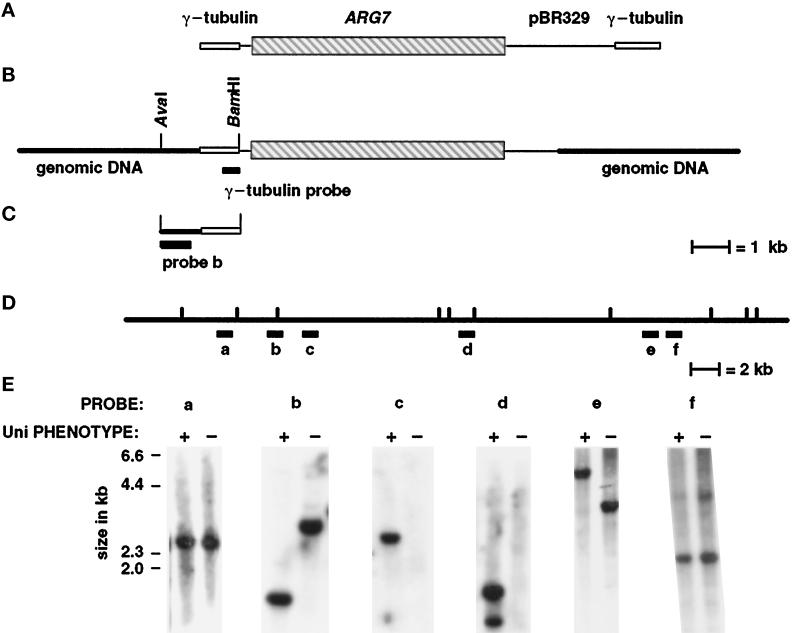
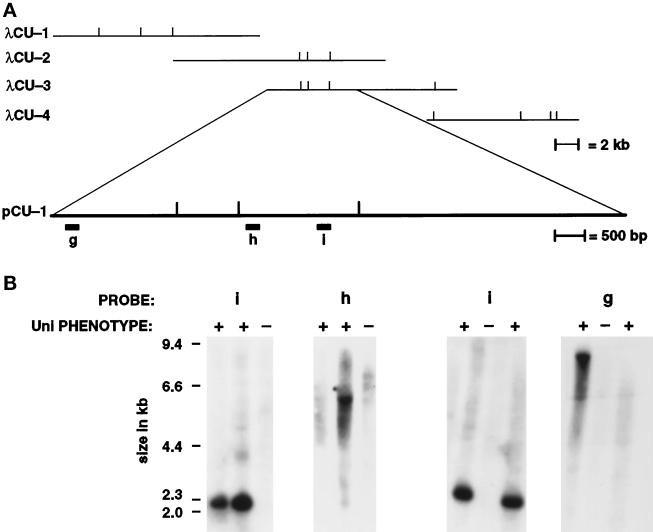
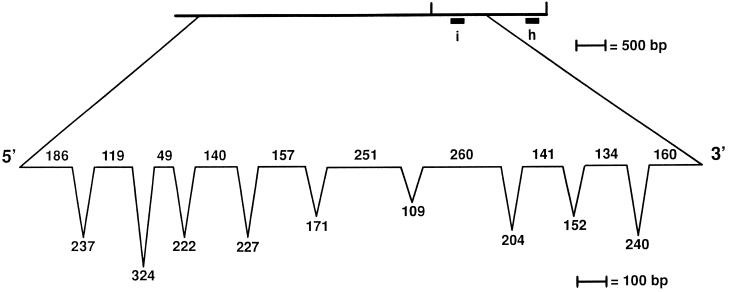
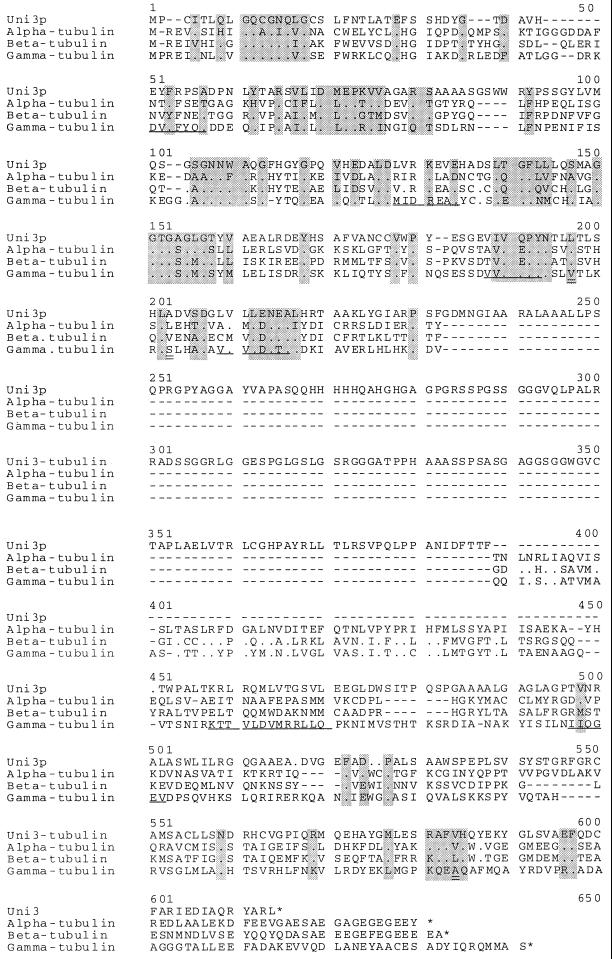
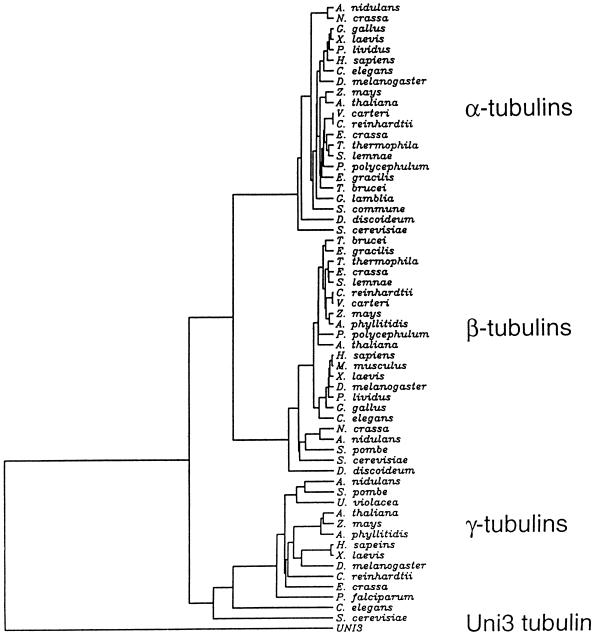
We have cloned the UNI3 gene in Chlamydomonas and find that it encodes a new member of the tubulin superfamily. Although Uni3p shares significant sequence identity with alpha-, beta-, and gamma-tubulins, there is a region of Uni3p that has no similarity to tubulins or other known proteins. Mutant uni3-1 cells assemble zero, one, or two flagella. Pedigree analysis suggests that flagellar number in uni3-1 cells is a function of the age of the cell. The uniflagellate uni3-1 cells show a positional phenotype; the basal body opposite the eyespot templates the single flagellum. A percentage of uni3-1 cells also fail to orient the cleavage furrow properly, and basal bodies have been implicated in the placement of cleavage furrows in Chlamydomonas. Finally when uni3-1 cells are observed by electron microscopy, doublet rather than triplet microtubules are observed at the proximal end of the basal bodies. We propose that the Uni3 tubulin is involved in both the function and cell cycle-dependent maturation of basal bodies/centrioles.


Figures

Figure 1
Figure 1
Diagram and electron micrographs of uni3–1 basal bodies. (A–D) Diagram of the cross-sectional images of a Chlamydomonas basal body based on Ringo (1967). Diagram A is the most proximal region and shows the classical cartwheel and diagram C is the most distal region of the basal body with triplet microtubules. Shown in diagram D is the appearance of doublet microtubules, which are attached to the plasma membrane. Panel E is a cross-sectional image that is likely to correspond to diagram B. Panel F is a tangential section that is represented by diagram C on the right side and diagram D on the left side. Final magnification in E and F is 125,000 ×.
Figure 2
Figure 2
Pedigree analysis of the mitotic progeny from uni3–1 cells. Individual cells were placed in 40 μl rich medium in microtiter wells. Upon mitotic cell division, each daughter cell was transferred into a new well, and the swimming phenotype was monitored under a dissecting microscope with 100× magnification. (A) In the left panel, the predicted fraction of pairs of daughter cells if the phenotype is random and independent of lineage. The fractions were calculated as simple probabilities for independent events. In the right panel are the observed numbers. The fractions indicate the number of cells with the diagrammed phenotype over the number of cells successfully transferred and observed. In the three pairs that did not follow the pattern diagrammed, both cells had no flagella when observed. (B) Twelve aflagellate cells were placed individually in microtiter wells, and progeny for three successive cell divisions were monitored. The fractions indicate the number of cells that showed the diagrammed pattern over the number successfully transferred and monitored. As in part A, cells that did not show the diagrammed pattern produced two aflagellate cells.
Figure 3
Figure 3
Diagram of the pΔγ-1 vector, the genomic insertion site, the size-selected genomic DNA clone with flanking sequences, and demonstration that uni3–1 is a deletion allele. (A) The vector pΔγ-1 carries the ARG7 gene (Debuchy et al., 1989), which is diagrammed as the striped box, and pBR329 sequences, which are diagrammed as black lines. At the ends, when the plasmid is linearized with EcoRI, are 1049-bp and 750-bp segments of the Chlamydomonas γ-tubulin gene, which are diagrammed as open boxes. (B) The orientation of the plasmid at the insertion site in uni3–1 cells. Most of the pBR329 and all of the γ-tubulin sequences were deleted from the right side as diagrammed. The 1,049 bp of γ-tubulin sequences from the left side of the pΔγ-1 plasmid remained in the transformant. (C) The cloned genomic DNA from the size-selected library made from AvaI–BamHI digested DNA from uni3–1 cells. Probe b was used to screen the phage libraries and contains single-copy DNA from the site of the insertion. (D) Restriction map of uni3–1 and wild-type DNA with the enzyme NheI. The location of probes a–f on the wild-type map are shown. Probe b in parts C and D are the same probe. (E) Southern blots of genomic DNA from uni3–1 and wild-type cells hybridized with probes a–f. The left lane in each panel contains wild-type DNA (+) and the right lane contains uni3–1 DNA (−).
Figure 4
Figure 4
The λ phage and plasmids used for transformation rescue and in vivo deletion analysis. (A) Phage λCU-1, λCU-2, λCU-3, and λCU-4 were obtained in the chromosome walk and were used for assaying rescue after transformation. The vertical bars indicate the recognition sites for the enzyme NheI. The subclone pCU-1 showed rescue of the Uni phenotype. (B) Southern blots of phenotypically rescued uni3–1 and control strains. Probes g, h, and i were hybridized against DNA from the rescued strains (+) and control uni3–1 strains (−). Probes g and h are found in the same NheI fragment as probe d in Figure 3D. Probe i was present in all strains shown as well as 13 other rescued strains. Probes g and h were present in some, but not all, of the rescued strains. The loss of portions of the transforming DNA in rescued strains was used to further delineate the DNA needed for the restoration of the wild-type phenotype to ∼5.5 kb.
Figure 5
Figure 5
Exon-intron distribution in the UNI3 gene. The length of the exons (on the line) and introns (below the line) are indicated and were determined based on comparisons of cDNA and RT-PCR products with the genomic sequence. At the exon–intron boundaries, we find the sequence G GT[GA] where the boundary is indicated by a vertical line ( ) and at intron-exon boundaries, we find the sequence CAG [GC]. Both of these sequences agree with the consensus for Chlamydomonas intron boundaries (LeDizet and Piperno, 1995).
Figure 6
Figure 6
Comparison of the predicted Uni3p with α-, β-, and γ-tubulin from Chlamydomonas. The sequences were aligned using the Pfam method (Sonnhammer et al., 1997). The γ-tubulin sequence was generated in our laboratory (see MATERIALS AND METHODS). At the amino acid level, this γ-tubulin sequence (GenBank Accession number AF013109) differs at three amino acids positions from the GenBank entry U31545 of γ-tubulin (C. D. Silflow, University of Minnesota, St. Paul). Using the numbering in U31545, the changes are V190L, S196T, and A411R. These amino acids are indicted by double underlines in this Figure at positions 197, 203, and 584. Gaps introduced by the alignment program to optimize the alignment are indicated by (−). Identity of amino acids is indicated by (.) and a stop codon is indicated by (*). There is greater similarity/identity in the amino terminus than in the carboxy terminus. The GenBank accession number for Uni3 tubulin is AF013108.
Figure 7
Figure 7
Phylogenetic tree of α-, β-, and γ-tubulins from different organisms compared with Uni3p using the method of Fitch-Margoliash. Only the horizontal distances are important for determining distances. In organisms with multiple tubulin genes, the following proteins were used in the tree: TBB1 and TBA5 from Gallus gallus; TBB2 from X. laevis; TBA1 from Paracentrotus lividus; TBB1 and TBA1 from D. melanogaster; TBB1, TBA1, and TBG1 from Zea mays; TBB1, TBA1, and TBG1 from Arabidopsis thaliana; TBB1 and TBA1 from Volvox carteri; TBB1 and TBAE from Physarum polycephalum; TBA2 from Stylonychia lemnae; TBA1 from Anemia phyllitidis, TBA2 from Mus musculus; TBA2 from Neurospora crassa; TBA1 from A. nidulans; and TBA1 from S. cerevisiae.

References

    1. Altschul SF, Gish W, Miller W, Myers EW, Lipman DJ. Basic local alignment search tool. J Mol Biol. 1990;215:403–410. - PubMed
    1. Bairoach A. The PROSITE dictionary of sites and patterns in proteins, its current status. Nucleic Acids Res. 1993;21:3097–3103. - PMC - PubMed
    1. Beech PL, Wetherbee R, Pickett-Heaps JD. Transformation of the flagella and associated flagellar components during cell division in the Coccolithophorid Pleurochysis carterie. Protoplasma. 1988;145:37–46.
    1. Burns RG. Identification of two new members of the tubulin family. Cell Motil Cytoskeleton. 1995;31:255–258. - PubMed
    1. Cabral F, Schibler M, Kuriyama R, Abraham I, Whitfield C. Genetic analysis of microtubule function in CHO cells. In: Borisy GG, Cleveland DW, Murphy DB, editors. Molecular Biology of the Cytoskeleton. Cold Spring Harbor, NY: Cold Spring Harbor Laboratory Press; 1984. pp. 305–317.

Publication types

Associated data

LinkOut - more resources