. 1998 Jun 15;18(12):4532-47.
doi: 10.1523/JNEUROSCI.18-12-04532.1998.

Multivesicular release at single functional synaptic sites in cerebellar stellate and basket cells

Affiliations

Multivesicular release at single functional synaptic sites in cerebellar stellate and basket cells

C Auger et al. J Neurosci. .

Abstract

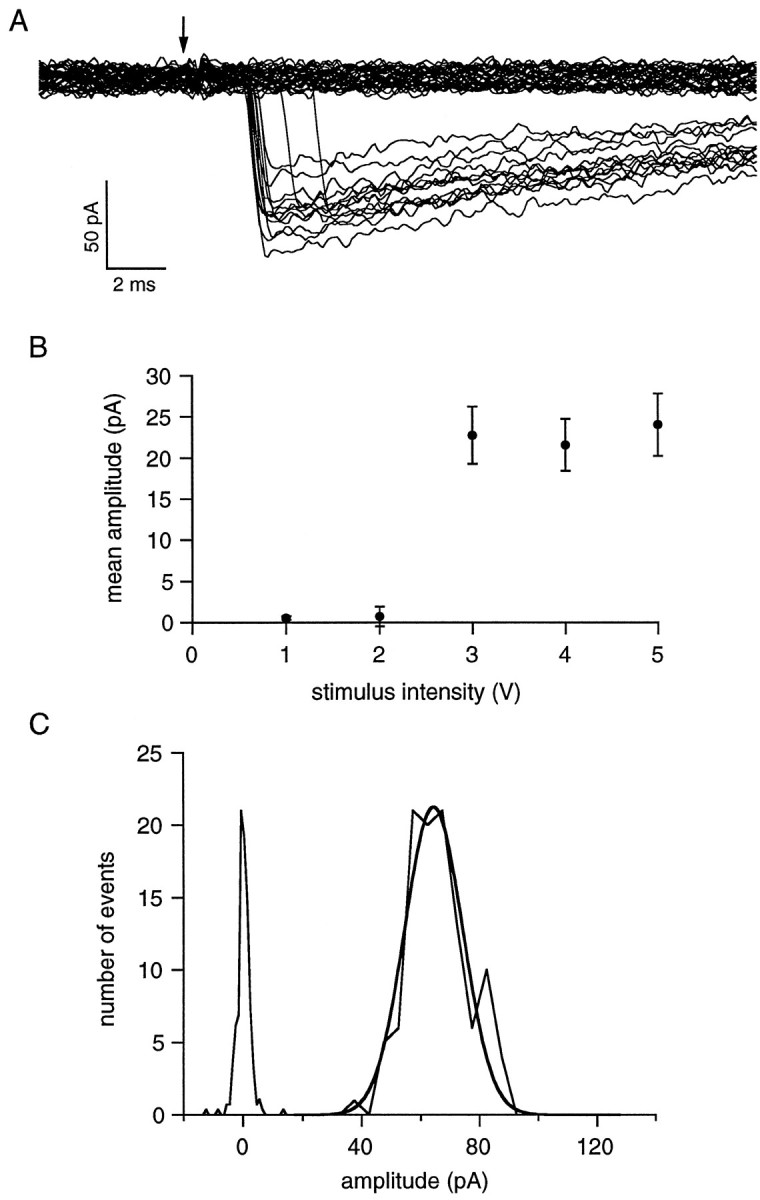
The purpose of the present work was to test the hypothesis that no more than one vesicle of transmitter can be liberated by an action potential at a single release site. Spontaneous and evoked IPSCs were recorded from interneurons in the molecular layer of cerebellar slices. Evoked IPSCs were obtained using either extracellular stimulation or paired recordings of presynaptic and postsynaptic neurons. Connections were identified as single-site synapses when evoked current amplitudes could be grouped into one peak that was well separated from the background noise. Peak amplitudes ranged from 30 to 298 pA. Reducing the release probability by lowering the external Ca2+ concentration or adding Cd2+ failed to reveal smaller quantal components. Some spontaneous IPSCs (1.4-2.4%) and IPSCs evoked at single-site synapses (2-6%) were followed within <5 msec by a secondary IPSC that could not be accounted for by random occurrence of background IPSCs. Nonlinear summation of closely timed events indicated that they involved activation of a common set of receptors and therefore that several vesicles could be released at the same release site by one action potential. An average receptor occupancy of 0.70 was calculated after single release events. At some single-site connections, two closely spaced amplitude peaks were resolved, presumably reflecting single and double vesicular release. Consistent with multivesicular release, kinetics of onset, decay, and latency were correlated to IPSC amplitude. We conclude that the one-site, one-vesicle hypothesis does not hold at interneuron-interneuron synapses.


Figures

Fig. 1.
Fig. 1.
Multiple IPSCs in interneurons. A, Examples of closely spaced (<5 msec) IPSCs from an interneuron. Three double events are shown with two different time and amplitude scales to illustrate both the overall time course of the events and blow-ups of the peak region. Note differences in time course and amplitudes among pairs, and the match between peak amplitudes and time courses near the peaks within pairs. B, Further examples of repetitive IPSCs from the same recording. Here several events of similar amplitudes are separated by intervals of 5–50 msec. C, Distribution of intervals between successive events. The histogram (bin size: 10 msec; total duration of the recording: 7.5 min) is fitted with the sum of two exponentials with time constants of 20 and 357 msec. (A third, very fast component corresponding to double events such as illustrated in A is not displayed here.) Initial amplitudes for the fast and slow components are in a ratio of 1.2:1.Insert, Initial part of the interval distribution. Thedotted line shows the slow exponential with a time constant of 357 msec.
Fig. 2.
Fig. 2.
Analysis of event amplitudes in doublets. Same recording as illustrated in Figure 1. A, Histogram of occurrence of doublets for short interevent intervals. Dotted line indicates the number of doublets expected on the basis of random superimposition of background activity. B, Schematic diagram showing the current amplitudes measured for the analysis. A1 andA2 are measured from the baseline to the peak of the IPSC, A′2 is measured from the onset to the peak of the IPSC. C,A2/A1 as a function of interevent interval. MostA2/A1ratios are closer to the value of 1 predicted by total event occlusion after saturation of postsynaptic receptors (continuous line) than to the curve expected on the basis of the summation of independent events (dotted line; calculated from the mean decay kinetics of IPSCs). D,A′2/A1versus interevent interval. The ratioA2:A1rises from a value that is close to 0 for short intervals up to ∼1. Some of the points shown in C are off-scale inD. Continuous line: time course predicted for total saturation, calculated from the decay kinetics of IPSCs. Again, predictions made on the basis of independence (dotted line) fail to account for the data. E, Histogram of A′2/A1ratios for the data shown in B. The dotted line represents predictions based on random superimposition of independent events (see Materials and Methods).
Fig. 3.
Fig. 3.
Single-site IPSCs elicited with external stimulation of a presynaptic interneuron. A, Fifty consecutive sweeps (except for 3 sweeps that were excluded because of contamination by background IPSCs) showing currents evoked by extracellular stimulation (5 V stimulus intensity). The time of the voltage step applied through the stimulation pipette is indicated by anarrow. Stimulation frequency is 1 Hz. An average failure sweep was subtracted from all displayed traces. Note that many stimulations result in transmission failures. B, Plot of mean amplitude (±SEM) versus stimulation intensity. The synaptic response has a sharp threshold for stimulations between 2 and 3 V, and there is no further increase with increasing intensity, indicating that there is no further recruitment of presynaptic connections. Such a stepwise dose–response curve is one requirement to ensure that a single presynaptic neuron is stimulated. C, Amplitude distributions for stimulations that elicited postsynaptic responses (bin size 10 pA) and for the failures (bin size 1 pA) (stimulus intensity: 5 V). The failures distribution was scaled to the distribution of IPSCs to allow comparison of the SDs. A Gaussian fit of the responses distribution is superimposed (thick line).n = 350 stimulation trials. The probability of successful responses was 32%; mean amplitude, 66 pA; CV (corrected for background variance), 13%. This type of distribution most likely corresponds to a single release site.
Fig. 4.
Fig. 4.
Effect of lowering the external calcium concentration at a single-site connection. A, Fifty consecutive sweeps in the presence of 2 mmCa2+ and 1 mm Mg2+(left), and 1.5 mm Ca2+and 1.5 mm Mg2+ (right). Successful responses are less frequent and have more homogeneous amplitudes in the low Ca2+ solution.Arrowheads indicate stimulation timing. An average failure sweep was subtracted for display. B, Amplitude distributions. Left, CTL, 2 mm Ca2+ and 1 mmMg2+. n = 500; proportion of failures: 65.8%; mean amplitude of responses (excluding failures): 131 ± 26 pA; CV = 19.7%. Middle, 1.5 mm Ca2+ and 1.5 mmMg2+. n = 200; proportion of failures: 83%; mean of responses: 120 ± 11 pA; CV = 9.2%.Right, Wash, n = 200; proportion of failures: 58.7%; mean of responses: 122 ± 24 pA; CV = 19.7%. C, Mean amplitude of responses (excluding failures; each point corresponds to 100 stimulation trials) versus time. The line is a linear fit of the control data; its negative slope reflects a slow rundown of the responses. In the presence of 1.5 mm Ca2+, the amplitude decreases slightly below the regression line, and the SD decreases by ∼50%. Both effects are reversible.
Fig. 5.
Fig. 5.
Effect of lowering the external Ca2+ concentration at a multisite connection.A, Control amplitude distribution. n= 1400; probability of failures: 17%; mean amplitude: 283 ± 151 pA; CV = 53.4%. B, Distribution in the presence of 1.5 mm Ca2+, 1.5 mmMg2+. n = 800; probability of failures: 35%; mean amplitude: 226 ± 146 pA; CV = 64.4%. Note that for a decrease of release probability of only 25%, the distribution is shifted to the left, the mean amplitude decreases by 20%, and the CV increases by 20%. C, Distribution in the presence of 1 mm Ca2+, 2 mm Mg2+. n = 300; probability of failures: 44%; mean amplitude: 165 ± 83 pA; CV = 50.4%.
Fig. 6.
Fig. 6.
Analysis of doublets for a single-site synapse. Data from a single-site connection (same experiment as in Fig. 4; results with control external solution) were analyzed as in Figure 2.Aa, Some IPSCs are followed by a secondary event. Measured values of A1 andA2 are indicated by short horizontal lines. Ab, Many events display an inflection point (arrowheads) in their rising phase. The two lower traces in Ab illustrate traces with a shallow minimum occurring 1–2 msec after the main current transition, indicating unresolved late vesicular release. All traces in A are taken from a sequence of 111 sweeps, during which a total of 51 responses were recorded. Of these, seven contained the doublets shown in Aa, and eight contained unresolved multiple events as shown in Ab. The timing of extracellular stimulations is indicated by arrows. B, The frequency of doublets decreases abruptly with intervals up to 5 msec. Dotted line, Frequency of doublets expected from random superimposition of evoked IPSCs with background IPSCs.C,A2/A1ratios are mainly between 1 and 1.5, particularly for intervals shorter than 5 msec. D, Histograms ofA2/A1ratios, both for the entire interval range (0–20 msec, open bars) and for intervals <5 msec (shaded bars).
Fig. 7.
Fig. 7.
A single-site synapse with two closely separated amplitude components. A, In this single-site recording, two distinct amplitude levels were observed. In several traces, double events were seen to jump from one level to the other (thick line responses), or to display an inflection point near the lower amplitude level (arrowhead). B, Overall amplitude histogram from this experiment (480 trials), showing two distinct peaks. In dual component traces only the peak amplitude of the second event was entered. The histogram was fitted to the sum of two Gaussian curves (thick line; dotted lines indicate each curve separately) with mean amplitudes and SD values of 147 ± 14 pA and 198 ± 20 pA, respectively. The scaled noise histogram is also shown (failure rate was 0.50).C, Histograms for first (thick line) and second (dotted line) halves of the data. Although the proportion of events in the higher amplitude peak decreased from the first to the second data range, the two peaks appear in both cases.
Fig. 8.
Fig. 8.
Kinetics of single and multiple events. Same data as in Figure 7. In A and B, the data have been split into two components: a low amplitude component, up to 150 pA, and a high amplitude component, for amplitudes larger than 180 pA. These threshold values were chosen such that each component contains almost exclusively events from one or the other of the two Gaussians used to fit the histogram in Figure 7B.A, Superimposed normalized means of the low (continuous line) and high (dotted line) amplitude components. Rising phases of individual events were aligned before averaging. The decay phases of the high and low amplitude IPSCs have been fitted using double-exponential curves, with respective parameters: τfast = 2.6 msec, τslow = 12.9 msec; weight of the slow component: 91% (high amplitude); τfast = 3.4 msec, τslow = 12.1 msec; weight of the slow component: 78% (low amplitude). B, Rising phases of the mean two components without scaling (a) and after normalization (b). The high amplitude component has a more prolonged rise time (+0.2 msec) and a more rounded peak.C, Mean currents grouped according to latency. The latencies range from 1.1 to 2.1 msec after the end of the stimulation artifact in 0.2 msec increments. The earlier latency values correspond to larger currents (dotted lines), whereas the later latencies correspond to smaller current amplitudes (continuous lines).
Fig. 9.
Fig. 9.
Latency–amplitude correlation in paired recordings. Results in A and B are from a single-site and multisite synapse, respectively. a, Amplitude histograms (failures are not shown). Aa, Mean current amplitude, 75 pA; total number of trials, 774; failure rate, 0.63. Ba, Mean current amplitude, 476 pA; total number of trials, 868; failure rate, 0.06. b, Latency distributions. Latencies are measured from the peak of the presynaptic action potential-related signal measured in the cell-attached mode. For each latency bin that contained more than five events, mean amplitude values ± SEM are displayed. Amplitudes are significantly correlated to latencies (p < 0.01). Regression lines have been drawn to the data, with slopes of −22 pA/msec (A) and −502 pA/msec (B). c, Average traces for latency bins in b containing more than five events.C, Summary data for 9 single-site synapses and 11 multisite connections. Some of the single-site synapses were contaminated with “slow” synaptic currents (Kondo and Marty, 1998).Aa is reproduced from Kondo and Marty, 1998.
Fig. 10.
Fig. 10.
Simulation of latency–amplitude correlation. Data from the experiment illustrated in Figure 9A. Simulations were made for a single-site synapse assuming various degrees of multivesicular release and receptor saturation.A, In this section the mean number of vesicles released per trial is 0.462, as calculated from the failure frequency for a pure Poisson process. The top panel (a) shows the original latency data (dots; bins of 0.25 msec), a corresponding model latency distribution, and the associated “driving function” describing the probability density of synaptic vesicles to undergo exocytosis (Eq. 8; τ = 0.25 msec; see Appendix for details). Latencies are shifted by 1.3 msec so that 0 time is the origin of the driving function. The middle panel(b) shows the calculated proportions of events corresponding to the fusion of one, two, or more than two vesicles as a function of latency. Note that the fraction of events with multivesicular release drops very quickly with time. The bottom panel (c) shows simulations of the mean amplitudes as a function of latency, assuming occupancy values of 0.5, 0.6, 0.7, and 0.8. None of these simulations comes close to the experimental data (dots; error bars show ± SEM).B, For these simulations the density probability of vesicular release was allowed to fluctuate between 0 for some of the trials and a constant driving function in the other trials. This introduced one more free parameter than in the simulations shown inA. For the simulation shown here the mean number of vesicles that was chosen was two. a, b, and c are arranged as in A. Occupancy values between 0.6 and 0.7 give a good fit to the data.

References

    1. Arancio O, Korn H, Gulyàs A, Freund T, Miles R. Excitatory synaptic connections onto rat hippocampal inhibitory cells may involve a single transmitter release site. J Physiol (Lond) 1994;481:395–405. - PMC - PubMed
    1. Auger C, Marty A. Heterogeneity of functional synaptic parameters among single release sites. Neuron. 1997;19:139–150. - PubMed
    1. Barbour B, Häusser M. Intersynaptic diffusion of neurotransmitter. Trends Neurosci. 1997;20:377–384. - PubMed
    1. Bekkers JM. Quantal analysis of synaptic transmission in the central nervous system. Curr Opin Neurobiol. 1994;4:360–365. - PubMed
    1. Clements JD. Quantal synaptic transmission? Nature. 1991;353:396. - PubMed

Publication types

Substances

LinkOut - more resources