. 1998 Jun 15;18(12):4560-9.
doi: 10.1523/JNEUROSCI.18-12-04560.1998.

Odorant response properties of convergent olfactory receptor neurons

Affiliations

Odorant response properties of convergent olfactory receptor neurons

T C Bozza et al. J Neurosci. .

Abstract

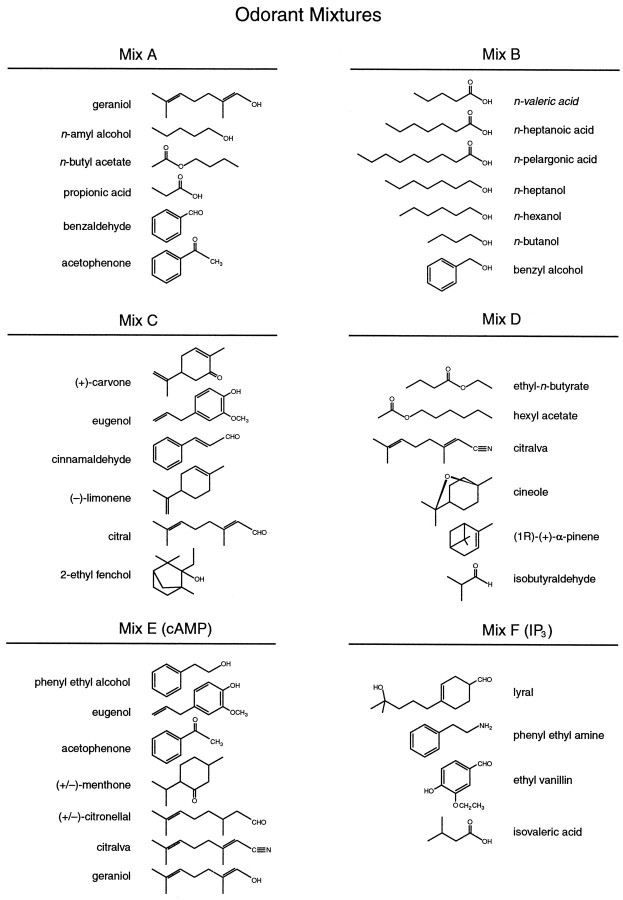
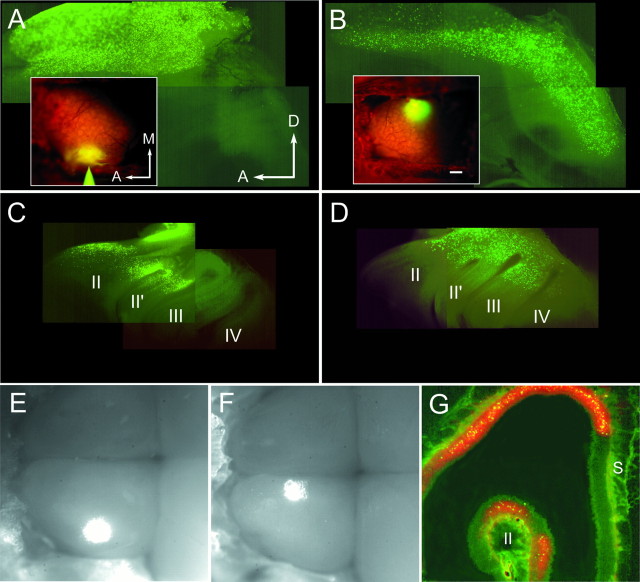
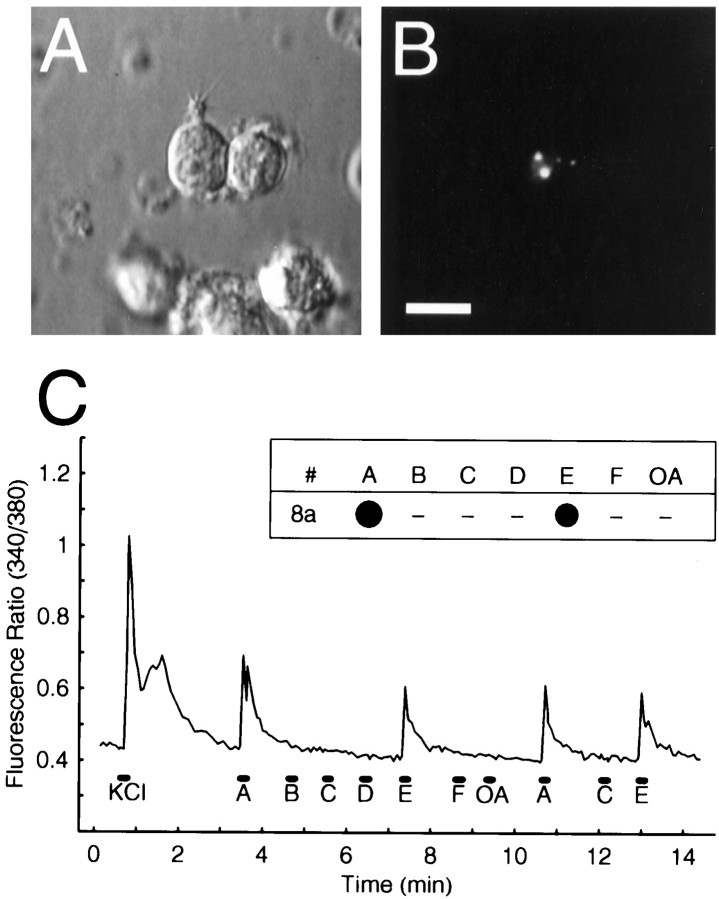
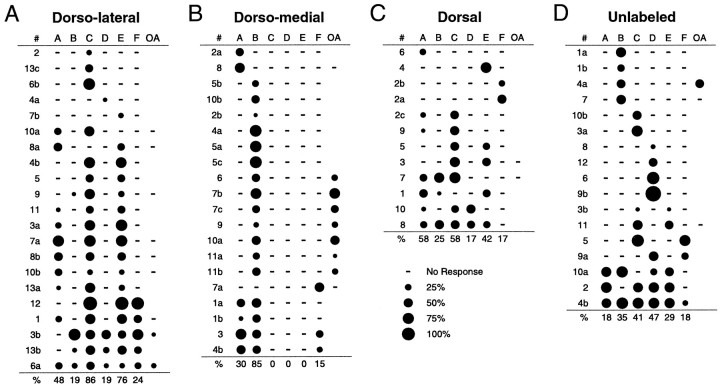
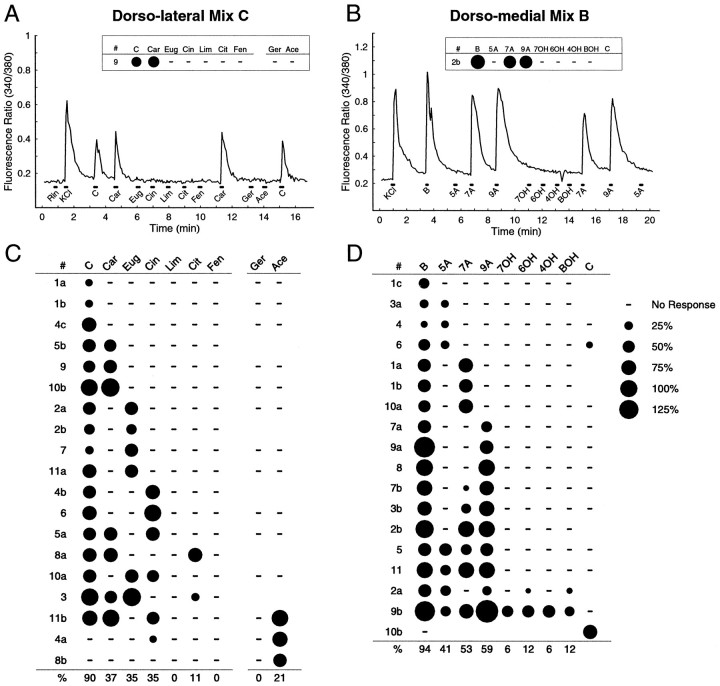
Information about odorant stimuli is thought to be represented in spatial and temporal patterns of activity across neurons in the olfactory epithelium and the olfactory bulb (OB). Previous studies suggest that olfactory receptor neurons (ORNs) distributed in the nasal cavity project to localized regions in the glomerular layer of the OB. However, the functional significance of this convergence is not yet known, and in no studies have the odorant response properties of individual ORNs projecting to defined OB regions been measured directly. We have retrogradely labeled mouse ORNs connecting to different glomeruli in the dorsal OB and tested single cells for responses to odorants using fura-2 calcium imaging. ORNs that project to clusters of dorsomedial (DM) glomeruli exhibit different odorant response profiles from those that project to dorsolateral (DL) glomeruli. DL-projecting ORNs showed responses to compounds with widely different structures, including carvone, eugenol, cinnamaldehyde, and acetophenone. In contrast, DM-projecting neurons exhibited responses to a more structurally restricted set of compounds and responded preferentially to organic acids. These data demonstrate that ORN afferents segregate by odorant responsiveness and that the homogeneity of ORN and glomerular input varies with different OB regions. The data also demonstrate that a subpopulation of ORNs projecting to DM glomeruli is functionally similar.


Figures

Fig. 1.
Fig. 1.
Molecular composition of the six odorant mixtures (A–F). Each mixture was designed to include many different classes of molecules (see Materials and Methods). Mix E and Mix F are mixtures of molecules that have been reported to increase cAMP and IP3, respectively (Sklar et al., 1986; Breer and Boekhoff, 1991). Four of the molecules in Mix E are also found in other mixtures: geraniol and acetophenone are in A and E, eugenol is in C and E, and citralva is inD and E.
Fig. 2.
Fig. 2.
Distribution of retrogradely labeled ORNs in the OE. A, B, insets, Fluorescence images of the dorsal OBs of living mice taken immediately after injection of fluorescein-labeled latex microspheres (yellow) into the DL (A) and DM (B) sites. Glomeruli are seen (orange) in the regions stained with RH414. A–D, Whole mounts of the septum (A, B) and the medial face of the turbinates (C, D) show the distribution of microsphere label 4 d after injection. The anterior lateral OE is reflected dorsally in A andB. Turbinates are numberedIIIV in C andD. DL labeling was detectable in the anterior septum (A) and in turbinates II andII′ (C). DM labeling formed an anterior to posterior band on the septal OE (B) and in the dorsal turbinates (D). Labeling in turbinate IV in D is out of the place of focus. E, F, Combined fluorescence and bright-field video images of both OBs exposed 2 d after injection with microspheres. In these images anterior is left, and the DL (E) and DM (F) injection sites are shown asbright spots in the left OBs.G, Coronal 20-μm-thick section through the nasal cavity showing microspheres (yellow) and RH414 (orange) label in the OE 3 d after a large injection into the dorsocentral OB. A, Anterior;M, medial; S, septum. Scale bar:A–D, insets, 200 μm; E, F, 230 μm;G, 100 μm.
Fig. 3.
Fig. 3.
Odorant responses of a retrogradely labeled ORN tested with odorant mixtures. A, Dissociated odorant-responsive ORN viewed under Nomarsky optics showing a short dendrite and cilia. B, Fluorescence image of the same field showing the microsphere labeling (white dots). Microsphere-labeled ORNs were often but not always labeled with RH414. Scale bar: A, B, 10 μm. C, Fura-2 measurements in a single retrogradely labeled ORN (dorsolateral#8a in Fig. 4A) stimulated with 10 sec pulses (black bars) of six odorant mixtures (A–F) and an OA mix, as well as with a 4 sec pulse of KCl. Inset, “Dot” plot of the odorant response profile derived from the analog data for this cell. Thedot area represents the response amplitude as a percentage of the KCl response; the largest responses observed to each mixture were used for these plots. Dashes indicate no response. This cell responded to mixes A and E.
Fig. 4.
Fig. 4.
Odorant response profiles for ORNs responsive to the odorant mixtures. A, DL-projecting microsphere-labeled ORNs (n = 21).B, DM-projecting microsphere-labeled ORNs (n = 20). C, RH414-labeled, D-projecting ORNs (n = 12). D, Unlabeled ORNs (n = 17). Each rowshows the responses of a single ORN to the six mixtures (A–F) as well as to the OA mix, as in Figure 3C. Blank spaces indicate that the stimulus was not tested, and dashes indicate no response. The percentage of responsive cells responding to each mixture is indicated below each plot. Cell identificationnumbers are to the left; within each panel, cells with the same number are from the same animal. Cells are ordered by increasing breadth of response.
Fig. 5.
Fig. 5.
Odorant responses of retrogradely labeled ORNs to individual mixture components. A, Calcium responses from a single DL-projecting ORN tested with mix C and its components, (+)-carvone (Car), eugenol (Eug), cinnamaldehyde (Cin), (−)-limonene (Lim), citral (Cit), and 2-ethyl fenchol (Fen) and with geraniol (Ger) and acetophenone (Ace), two components of mixes A and E.Rin and KCl mark stimulations with normal and high-K+ Ringer’s solution, respectively.B, Calcium responses from a single DM-projecting ORN tested with mix B and its components, n-valeric acid (5A), n-heptanoic acid (7A), n-pelargonic acid (9A), n-heptanol (7OH), n-hexanol (6OH), n-butanol (4OH), and benzyl alcohol (BOH) and with mix C. Dot response profiles for the two cells are shown in the insets. The small dip in the ratio after 4OH in B is an optical artifact. C, D, Summary of response profiles (as in Fig. 4) for 19 DL-projecting and 18 DM-projecting ORNs.Blank spaces indicate that the stimulus was not tested, and dashes indicate no response.

Similar articles

Cited by

References

    1. Astic L, Saucier D. Anatomical mapping of the neuroepithelial projection to the olfactory bulb in the rat. Brain Res Bull. 1986;16:445–454. - PubMed
    1. Astic L, Saucier D, Holley A. Topographical relationships between olfactory receptor cells and glomerular foci in the rat olfactory bulb. Brain Res. 1987;424:144–152. - PubMed
    1. Bell GA, Laing DG, Panhuber H. Odor mixture suppression: evidence for a peripheral mechanism in human and rat. Brain Res. 1987;426:8–18. - PubMed
    1. Breer H, Boekhoff I. Odorants of the same odor class activate different second messenger pathways. Chem Senses. 1991;16:19–29.
    1. Cinelli AR, Hamilton KA, Kauer JS. Salamander olfactory bulb neuronal activity observed by video rate, voltage-sensitive dye imaging: III. Spatial and temporal properties of responses evoked by odorant stimulation. J Neurophysiol. 1995;73:2053–2071. - PubMed

Publication types

LinkOut - more resources