. 1998 Jun 15;18(12):4570-87.
doi: 10.1523/JNEUROSCI.18-12-04570.1998.

Changes in mitochondrial function resulting from synaptic activity in the rat hippocampal slice

Affiliations

Changes in mitochondrial function resulting from synaptic activity in the rat hippocampal slice

V P Bindokas et al. J Neurosci. .

Abstract

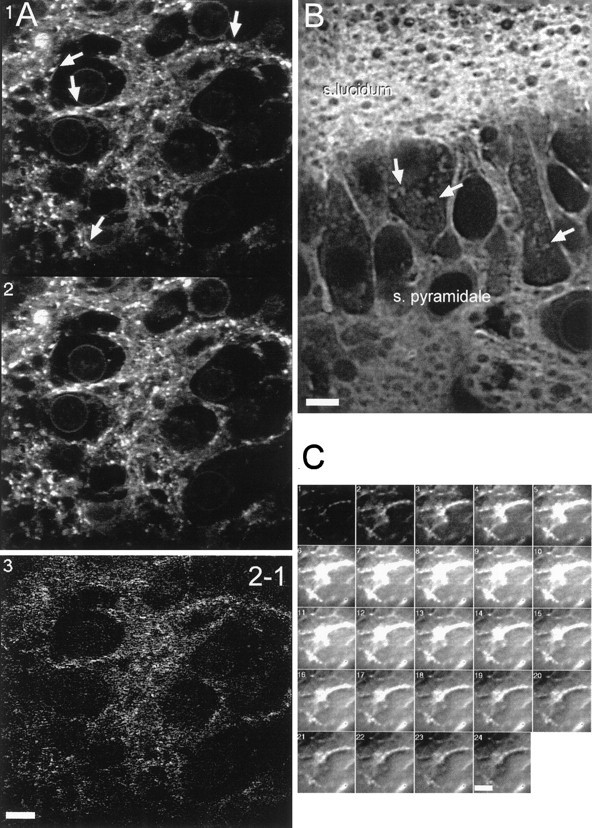
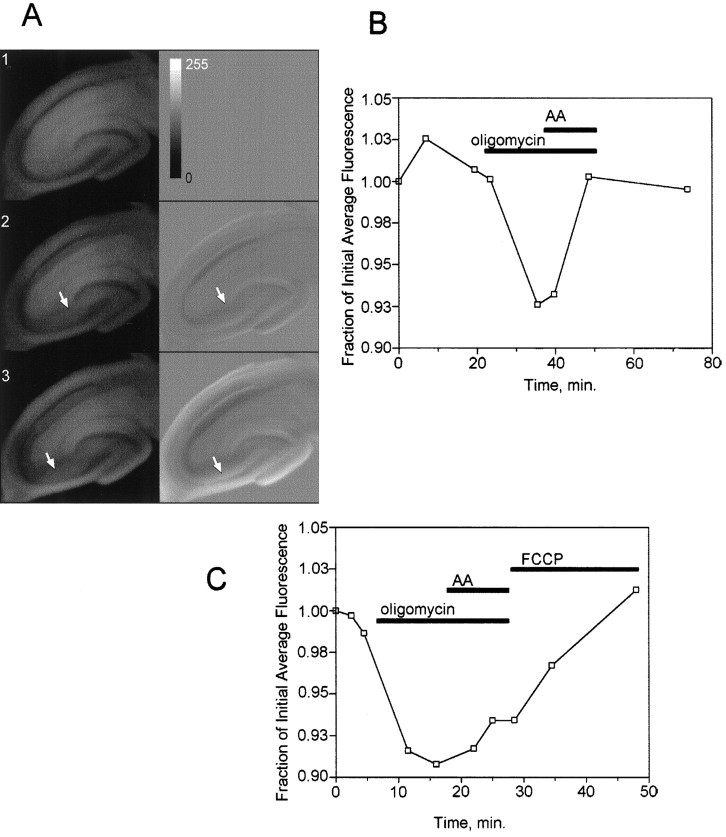
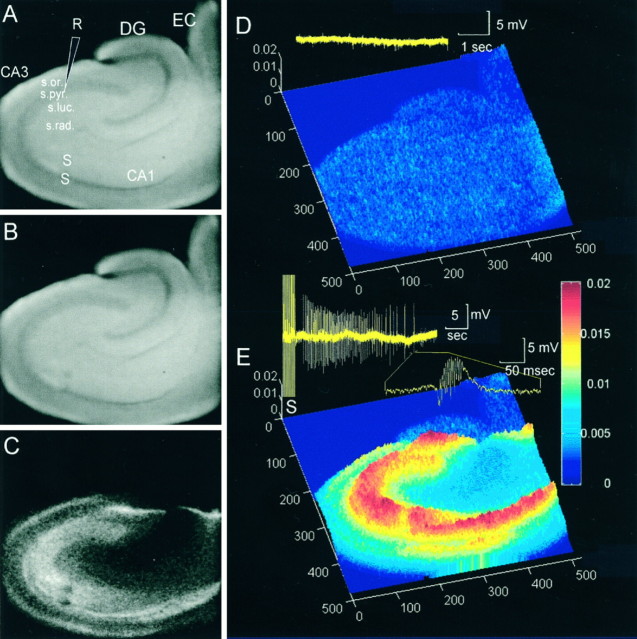
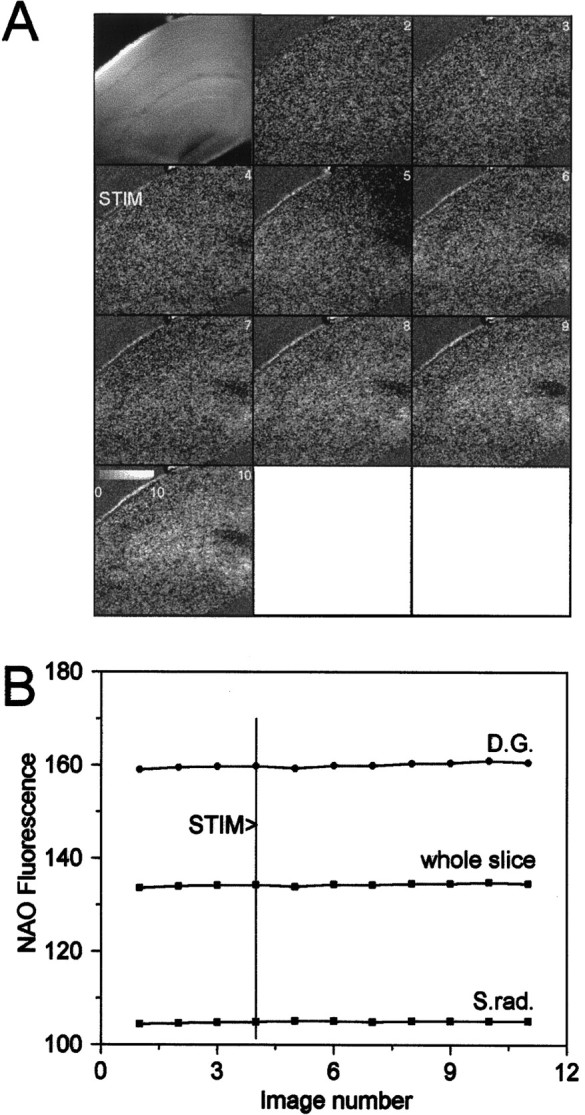
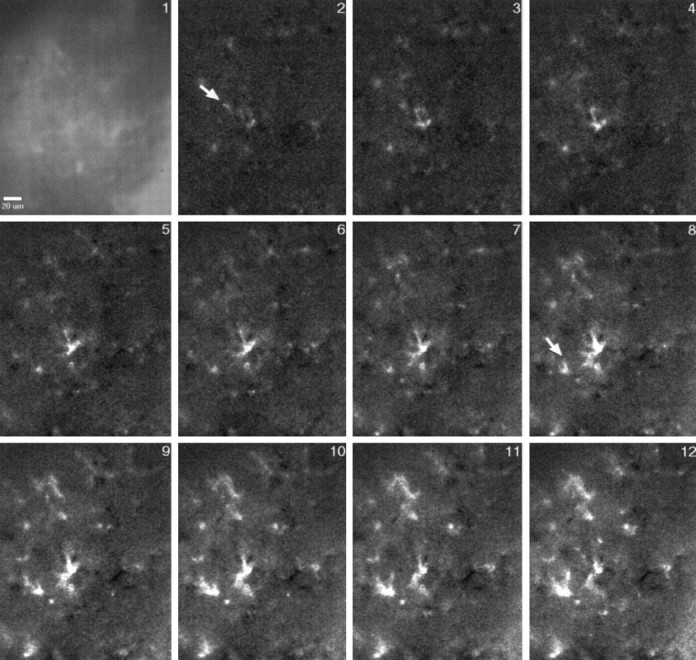
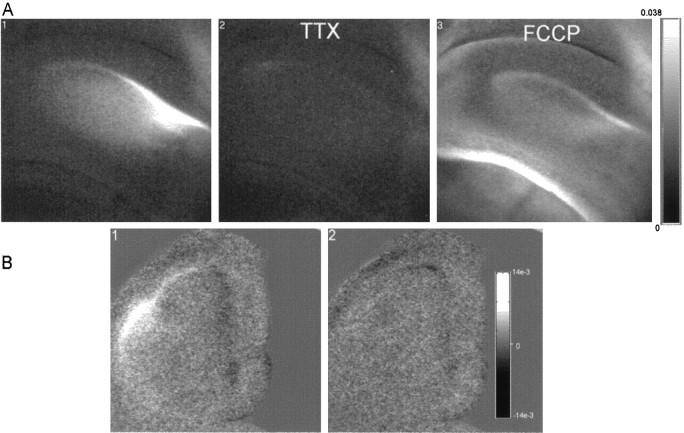
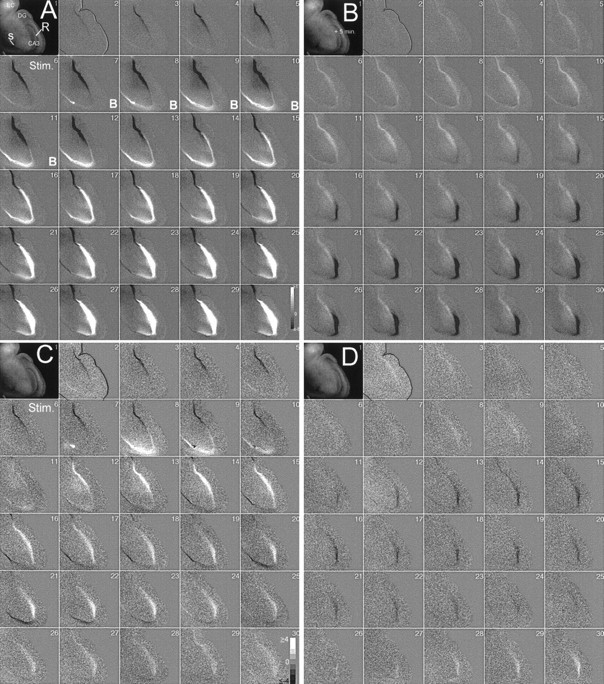
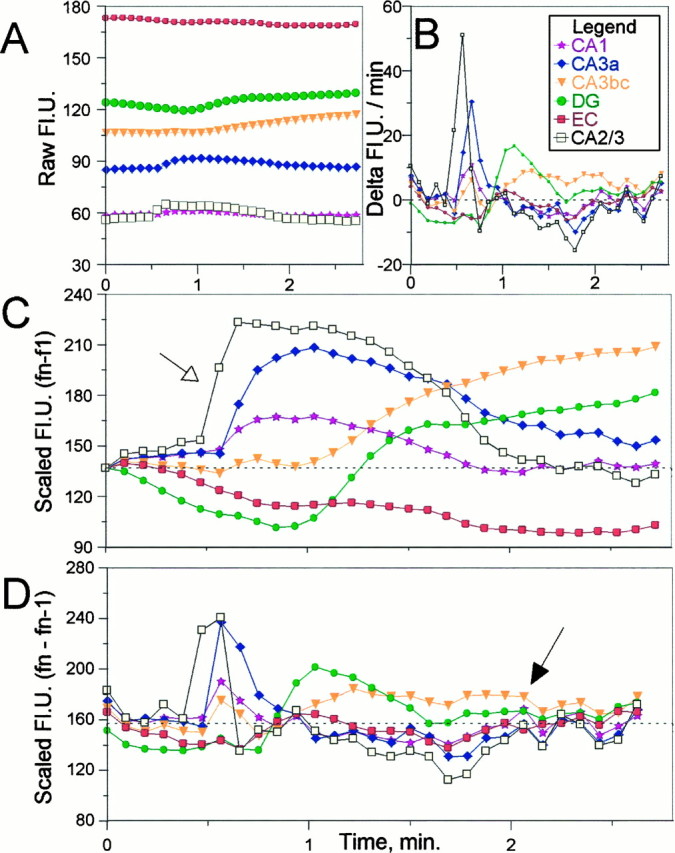
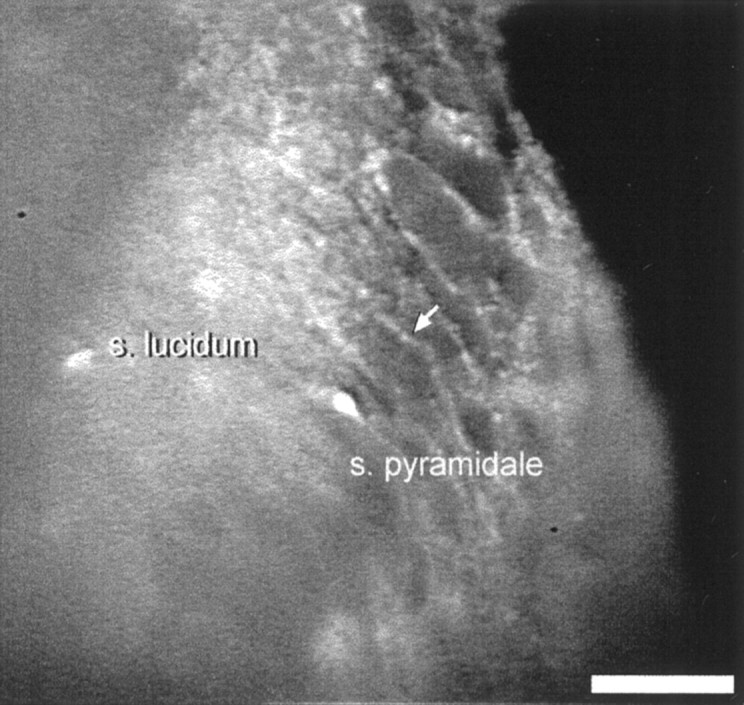
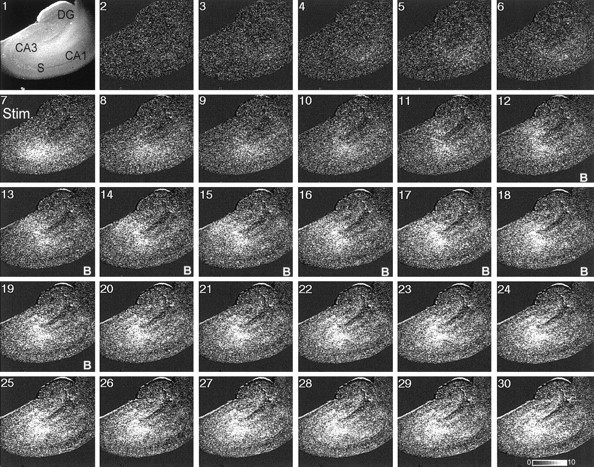
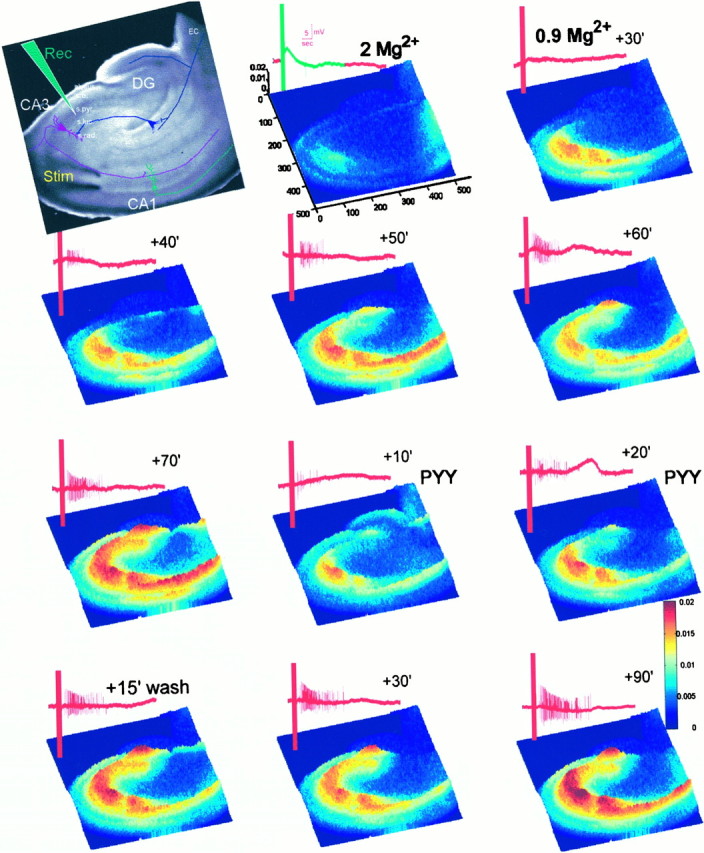
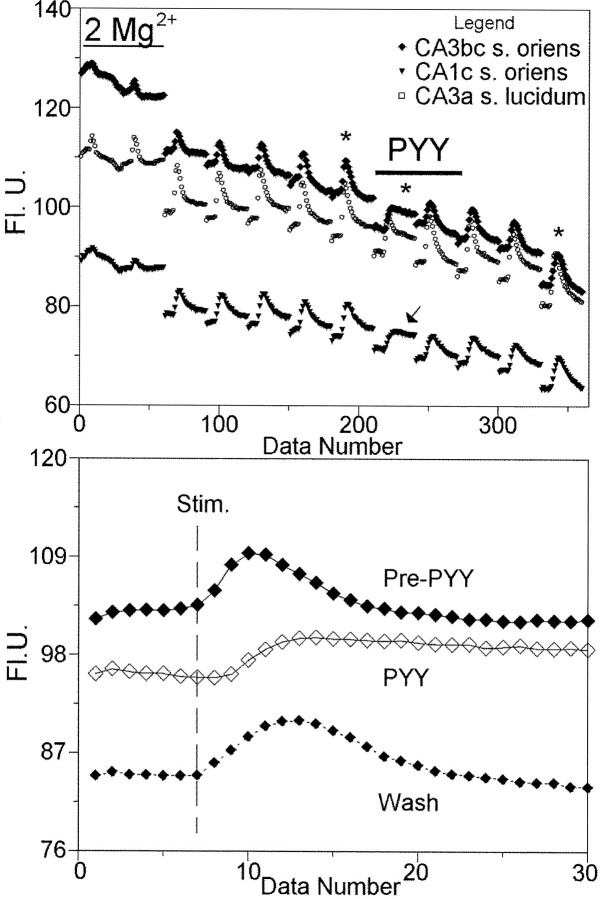
Digital imaging microfluorimetry was used to visualize changes in mitochondrial potential and intracellular Ca2+ concentration, [Ca2+]i, in thick slices of rat hippocampus. Electrical activity, especially stimulus train-induced bursting (STIB) activity, produced slow, prolonged changes in mitochondrial potential within hippocampal slices as revealed by fluorescence measurements with rhodamine dyes. Changes in mitochondrial potential showed both temporal and spatial correlations with the intensity of the electrical activity. Patterned changes in mitochondrial potential were observed to last from tens of seconds to minutes as the consequence of epileptiform discharges. STIB-associated elevations in [Ca2+]i were also prolonged and exhibited a spatial pattern similar to that of the mitochondrial depolarization. The mitochondrial depolarization was sensitive to TTX and glutamate receptor blockers ([Mg2+]o and CNQX or DNQX plus D-AP-5) and to the inhibition of glutamate release by activation of presynaptic NPY receptors. The monitoring of mitochondrial potential in slice preparations provides a new tool for mapping synaptic activity in the brain and for determining the roles of mitochondria in regulation of brain synaptic activity.


Figures

Fig. 1.
Fig. 1.
Rhodamine dyes stain mitochondria within thick hippocampal slices. Staining slices with rhodamine dyes results in a punctate staining pattern that is similar for R123, TMRM, and TMRE.A, Scanning laser confocal images of CA pyramidal neurons that were double stained with TMRE and NAO, a potential-insensitive dye, reveal that dyes are localized within mitochondrion-like organelles (e.g., arrows) that are especially abundant in the neuropil surrounding the neuronal somata. The NAO signal was colocalized to the TMRE compartments (data not shown); however, NAO also weakly stained other cellular membranes such as the nuclear envelope as is faintly evident in these images. This nonmitochondrial signal is absent in slices stained only with TMRM, TMRE, and R123 (e.g., B). A2 shows a second scan at this optical plane ∼15 sec later and during the occurrence of a spontaneous wave of change in fluorescence. The pixel-by-pixel digital subtraction of A2A1 shown in A3 reveals that this spontaneously occurring increase in TMRE fluorescence is primarily restricted to the vicinity of the brightly stained organelles.B, A confocal image of a slice stained with R123 is shown. Mitochondria are present within the somata of CA3 pyramidal neurons (e.g., arrows). The s. lucidum (top) is strongly stained, indicating the presence of many mitochondria and/or mitochondria with greater transmembrane potentials. C, A TMRE-stained slice viewed at high magnification under conventional fluorescence optics and the spontaneously occurring changes in fluorescence over time are shown. These images, taken every 4 sec, are unprocessed data. Brightly stained organelles appear to outline the pyramidal neuronal somata (darker voids). The fluorescence increases first appear in the mitochondria and then spread to other cell regions. Weak oscillations are evident in some mitochondria, but these details are best observed in digital movies available in the electronic edition of this paper (http://www.jneurosci.org/supplemental/18/12/4570). Scale bars: A, B, 5 μm;C, 10 μm.
Fig. 2.
Fig. 2.
Fluorescence signals from hippocampal slices stained with R123 conform to expectations for mitochondrial hyper- and depolarizations. A, Left, The raw fluorescence images from a slice stained with R123 before (A1) and after (A2) treatment with the F1–F0 ATP synthase inhibitor oligomycin (10 μm) and after the later addition of the electron transport chain inhibitor AA (10 μm) (A3) are shown.Right, The digital subtraction of the first image from the other images (here a constant offset of 150 was added to visualize signal decreases, and no other contrast manipulations were performed), indicating where fluorescence changes occurred, is shown. Oligomycin produced a decrease in overall fluorescence, especially in the CA3 region (arrows), consistent with a mitochondrial hyperpolarization. AA increased fluorescence (e.g.,arrows) consistent with its ability to depolarize mitochondria. B, The full time course for this experiment is shown. Average fluorescence over the entire slice was normalized to the initial value. The average change in fluorescence was −7% in oligomycin and was followed by full recovery in AA in this example. Durations of treatments are indicated by horizontal bars. C, Similar effects are shown for a different slice. The protonophore FCCP (1 μm) appears to produce a more rapid mitochondrial depolarization and an average fluorescence increase that exceeded the initial level. The actual width of panels in A is 3.3 mm. Thegray scale (A, top right) ranges from 0 to 255 arbitrary fluorescence units (Fl.U.). Similar results were obtained in eight other experiments.
Fig. 3.
Fig. 3.
Electrical stimulation increases R123 fluorescence in the hippocampal slice in aCSF containing 0.9 mmMg2+. A slice was loaded with R123, and fluorescence changes were analyzed by obtaining periodic sets (stacks) of 30 images (128 video frame averages; ∼4 sec each) as described in Materials and Methods. A shows the digital average of the first six images, an image stack for baseline staining pattern. Note that the staining is fairly uniform and that the soma layers appeardark. Indicated are the stimulation electrodes (S), a diagram of the recording electrode (R), and the approximate locations of theEC, DG, s.or.,s.pyr., s.luc., and s.rad.The width of the image is 3.3 mm. B is the mean fluorescence averaged over six images collected immediately after those used in A and during and after application of a stimulus train (see Materials and Methods). C is the digital difference of BA and has been contrast enhanced to reveal regions of fluorescence increase. Note that most of the fluorescence increase is confined to thes.pyr., s.luc., ands.rad., as well as to a bright band of increase from theEC through the DG. The brightest regions represent an increase of 3 Fl.U. D shows a three-dimensional mesh plot of the pixel-by-pixel SD for the six images averaged in A. SD is encoded by both height on thez-axis and color and depicts the location and magnitude of fluorescence changes. The inset(yellow) above the plot is the record of electrical activity during the final image just before electrical stimulation. E shows the SD forB. The insets show the electrical record with the stimulus train (S), a brief delay, and STIB activity that occurred during collection of the six images. Detail of the final burst is shown on a faster time base. Thecolor scale used in D andE corresponds to SDs ranging from 0 to 0.02 Fl.U. The actual width of panels AE is 3.3 mm. Data are representative of seven similar experiments.
Fig. 4.
Fig. 4.
Changes in intrinsic optical properties produce relatively small changes in the fluorescence of potential-insensitive mitochondrial dyes. A, This slice was stained with the potential-independent, mitochondria-labeling stain NAO (1 μm) and treated like the rhodamine-stained slices. The fluorescence image in the first panel shows a staining pattern similar to that seen with potential-sensitive mitochondrial dyes. A2A10 show changes in fluorescence signal relative to this first image (FnF1). Electrical stimulation occurs during or within A4(STIM). Note the small change in fluorescence with this potential-independent dye versus the relatively large changes in rhodamine signals (see Figs. 3, 6, 7 for a comparison) and in the rhod-2 signal (see Fig. 10). There are some small increases (lighter) and decreases in the fluorescence signal evident in A5A10, but the mean change is of the same order of magnitude as that seen in unstained slices (i.e., the “intrinsic optical signal”; mean change = 1 Fl.U. in this example) and is much smaller than the rhodamine fluorescence signal we report. The image manipulations and the fluorescence scale bar (0–10 Fl.U.) shown in A10 are identical to those used below (see Fig. 10). The original image width was 3.3 mm.B, Quantitation of the NAO fluorescence changes is shown for the dentate gyrus (top), the average over the whole slice (middle), and for the s. radiatum near the stimulation electrode (bottom) for this example. Data are representative of three similar experiments.
Fig. 5.
Fig. 5.
High-magnification (40×) detail of the spontaneous changes in R123 fluorescence in a hippocampal slice. The type and degree of observed activity was highly variable from region to region and from preparation to preparation. Frame 1shows the nonuniform staining pattern observed in the hilar region. The endal limb of the DG lies at the top and right edges of the image; CA3 lies just below the left bottom corner. This staining pattern was dynamic. Frames 2–12 show the relative change (FnF1) in fluorescence for 12 successive images (128 frame averages). Note that the fluorescence increases (brighter gray scale values) are limited to somata and their cellular processes, that they progress around single cells (frames 2–7; cell indicated byarrow), and that they appear to propagate between cells (frames 8–12; arrow). Relative decreases in fluorescence (darker gray scale values) follow the increases. These details are best observed in digital movies available in the electronic edition of this paper (http://www.jneurosci.org/supplemental/18/12/4570). The data shown here span 70 sec and represent raw fluorescence changes of up to 8 fluorescence units.
Fig. 6.
Fig. 6.
Stimulus-associated increase in R123 fluorescence is proportional to electrical activity. A shows average SD plots (see Materials and Methods) for fluorescence across an image stack after electrical stimulation and after application ofTTX or FCCP. A1 shows the basal response in which fluorescence increased (data not shown) after stimulation. Mean SD was 0.0069 Fl.U. (range, 0–0.0387), and most of the change was limited to a band near CA1 (top).A2 shows that TTX (1 μm) added for 5 min prevented the localized changes in fluorescence after electrical stimulation. STIB activity was suppressed (data not shown). Mean SD was 0.0045 (range, 0–0.0141). A3 shows that after washout of TTX and recovery (data not shown), application of the mitochondrial uncoupler FCCP (1 μm) immediately produced more general increases over the entire slice and especially along the lower soma layer. Mean SD was 0.011 (range, 0–0.0377). Black represents no change (0), and white is SD ≥ 0.038. Data are representative of three similar experiments. B shows mean derivative plots before (B1) and 10 min after (B2) treatment with d-AP-5 (50 μm) plus CNQX (10 μm). The control plot (B1) shows a net increase in fluorescence in the CA1 and CA2/3 region (bright band) and a fluorescence decrease (dark band) from DG to CA3b after stimulation that resulted in STIB (26 bursts; data not shown). Glutamate antagonists eliminated the STIB activity after stimulation (0 bursts) and also the increase in fluorescence. The grand average of all mean derivatives was 1.4e−4 (range, −4.1e−4 to 1.4e−3) before and 7.9e−5(range, −5.4e−4 to 6.8e−4) after glutamate antagonists in this example. The actual width offrames is 3.3 mm. Data are representative of five similar experiments.
Fig. 7.
Fig. 7.
Stimulation produces larger and longer-lasting changes in mitochondrial activity compared with spontaneous electrical activity. Four sets of 30 images are shown. A,B, The incremental change in R123 fluorescence compared with the initial staining fluorescence (FnF1) shown in frame 1 of each series. These image sets reveal net fluorescence changes compared with the initial image over the entire 2.5 min data collection period. C, D, The reanalyses of the same data sets shown in A and Bshowing the fluorescence change between “successive” images [FnF(n − 1)]. These lower sets show fluorescence changes over ∼8 sec intervals. Data from the stimulated (A, C) and nonstimulated (B, D) preparation (5 min after the collection of A, C, respectively) are shown. The slice outline is visible and constant within these digitally subtracted images. The background is uniform and constant, whereas the area within the slice is filled with fine-grained noise producing the “salt-and-pepper” fill pattern. Slice edges are also manually outlined in the second frame within each data set. Stimulation (A6) produced STIB activity duringA7A11 (record not shown; frames labeled B) and a more intense and longer-lasting increase in fluorescence compared with that in the nonstimulated data set (image set B). Reanalysis (C) of the data in A, displaying the differences between successive images, reveals that the apparently constant changes are because of a series of faster, wave-like mitochondrial depolarizations masked by a persistent depolarization. The stimulated rise subsides as the STIB ended during C11, and a new wave invaded from the EC toward the CA3. This wave waned forC16C20, briefly revived (C21C24), and then finally stopped despite the persistent depolarization still present in CA3 (seeA30). For spontaneous activity shown inB, this analysis method revealed a depolarization wave in D26D30, a period when the net fluorescence was lower than the initial level (seeB26B30). Scale bars forgray scale coding are shown in A30 andC30 for actual (raw) fluorescence changes occurring inA and B and in C andD, respectively, and are constant for each type of data presentation (A = B;C = D). The actual width of frames is 3.3 mm. Data are representative of 16 similar experiments. Data are available as time-lapse movies in the electronic edition of this paper (http://www.jneurosci.org/supplemental/18/12/4570).
Fig. 8.
Fig. 8.
Raw data intensity plots and analyses of data presented in Figure 7, A and B.A, B, Raw mean intensities for regions of the slice (A) and the corresponding first derivative plots for this raw data (B). Thelegend is common to all panels. Electrical stimulation produced a large, fast depolarization first in the CA2/3 region (squares) near the electrode and slower, delayed rises in other regions (B).C, The corresponding cumulative changes in potential for scaled data from Figure 7A. This plot likewise identifies regions of increased and decreased R123 fluorescence relative to the initial image in the data set. The rise near the stimulation site was most rapid and long-lasting (arrow). The dotted reference line is thegray level indicating no change. D, The corresponding plots from the successive, pairwise difference images (Fig. 7B). The data are essentially the same as the derivative plot from raw data (compare with B). Note the oscillation in mitochondrial potential during the final 1 min of the plot (e.g., arrow). The dotted reference line is the gray level indicating no change.
Fig. 9.
Fig. 9.
Distribution of fluorescence signal from a hippocampal slice loaded with rhod-2 AM is identical to that obtained with potentiometric rhodamine dyes. This high-magnification image of an obliquely sectioned slice shows sparse staining of the large CA3 pyramidal neuronal somata, punctate staining at the margins of the somata (arrow), and more intense staining of the s.luc. region. Compare this staining pattern with that of R123 shown in Figure1B. Scale bar, 50 μm.
Fig. 10.
Fig. 10.
Changes in [Ca2+]i, measured with rhod-2 (see Materials and Methods), occur with spatial and temporal patterns similar to that of the mitochondrial depolarizations. Images show the relative fluorescence changes compared with the first image. Electrical stimulation (frame 7;STIM) produced a delayed STIB response duringframes 12–19 (B). Stimulation electrodes were situated as indicated in frame 1(S). The increase in [Ca2+]i decreased after stimulation (frames 8–10) and increased again just before recording STIB activity (frame 10). The average increase over the entire slice was 2.1 Fl.U. and was 4.5 Fl.U. within the s.rad. Gray scale for the composite montage was optimized for image contrast (scale bar range, 0 to ≥10 Fl.U.). Data are representative of three similar experiments. The actual width of panels is 3.3 mm. Data are available as time-lapse movies in the electronic edition of this paper (http://www.jneurosci.org/supplemental/18/12/4570).
Fig. 11.
Fig. 11.
Mitochondrial depolarization is proportional to electrical activity and sensitive to effects of the neuropeptide PYY. The slice was loaded with R123 and stimulated via electrodes (visible in the top left, Stim). Illustrated are the major connections between regions in the slice. Electrical recordings were obtained from a micropipet situated in the s.pyr., as indicated (Rec), and are shown as the red insets above each panel. Each panel is a SD plot of the six images collected during and after the electrical stimulation. The plots show the location and magnitude of changes in mitochondrial potential. Stimulation in aCSF with 2 mmMg2+ (mid upper row) produced a small mitochondrial depolarization in the vicinity of the electrodes. The region of the electrical record highlighted in greenindicates the approximate time span over which the plotted data were collected in all panels. The z-axis of each panel corresponds to a maximum SD of 0.02 Fl.U. Thethird panel (top right) shows increased mitochondrial depolarization after electrical stimulation 30 min after changing to aCSF containing 0.9 mm Mg2+.Panels 4–7 (second row and third row, left) were recorded at 10 min intervals and show progressively greater regenerative electrical activity elicited by the stimulus train, concomitant with an increase in the extent and magnitude of mitochondrial depolarization. Ten minutes after superfusion with PYY (1 μm; first PYY panel), both the electrical and mitochondrial responses were attenuated. Both properties increased 10 min later (second PYY panel), and both greatly increased at 15, 30, and 50 min after washout of PYY (bottom panels, respectively). Data are representative of seven similar experiments. Movies of the corresponding two-dimensional SD plots of the pre-, PYY, and recovery data are available in the electronic edition of this paper (http://www.jneurosci.org/supplemental/18/12/4570).
Fig. 12.
Fig. 12.
Raw fluorescence intensity plots for data shown in Figure 11. Top, Complete time course for fluorescence changes. Data from three regions (s.oriens near recording electrode, s.oriens in CA1c region, and s.luc. near stimulation electrode; see Fig. 11) are shown for each image collected. The x-axis indicates data number rather than time to facilitate display (experiment duration = 3.3 hr; each data point taken ∼5 sec apart; data blocks are separated by 10–50 min). Two stimulations in aCSF with 2 Mg2+ produced large rises near the electrode and relatively little change in the s.oriens. The amplitude of the stimulation-evoked fluorescence increased at all sites during continued application of aCSF with 0.9 mmMg2+. PYY suppressed the increase and altered the kinetics of fluorescence changes (e.g., see arrow). After washout of PYY, the magnitude of the fluorescence changes continued to increase. Note the gradual, general loss of baseline fluorescence over the course of the experiment. Durations of treatments are indicated by horizontal bars. Bottom, The response for the CA3b/c s.oriens region shown in greater detail for data sets indicated by the asterisks (top).

References

    1. Alagarsamy S, Lonart G, Johnson KM. Regulation of nitric oxide synthase activity in cortical slices by excitatory amino acids and calcium. J Neurosci Res. 1994;38:648–653. - PubMed
    1. Anderson WW, Lewis DV, Swartzwelder HS, Wilson WA. Magnesium-free medium activates seizure-like events in the rat hippocampal slice. Brain Res. 1986;398:215–219. - PubMed
    1. Anderson WW, Swartzwelder HS, Wilson WA. The NMDA receptor antagonist 2-amino-5-phosphonovalerate blocks stimulus train-induced epileptogenesis but not epileptiform bursting in the rat hippocampal slice. J Neurophysiol. 1987;57:1–21. - PubMed
    1. Andrew RD, MacVicar BA. Imaging cell volume changes and neuronal excitation in the hippocampal slice. Neuroscience. 1994;62:371–383. - PubMed
    1. Ankarcrona M, Dypdukt JM, Bonfoco E, Zhivotovsky B, Orrenius S, Lipton SA, Nicotera P. Glutamate-induced neuronal death: a succession of necrosis or apoptosis depending on mitochondrial function. Neuron. 1995;15:961–973. - PubMed

Publication types

LinkOut - more resources