. 1998 Jun 15;18(12):4673-83.
doi: 10.1523/JNEUROSCI.18-12-04673.1998.

Electrophysiological development of central neurons in the Drosophila embryo

Affiliations

Electrophysiological development of central neurons in the Drosophila embryo

R A Baines et al. J Neurosci. .

Abstract

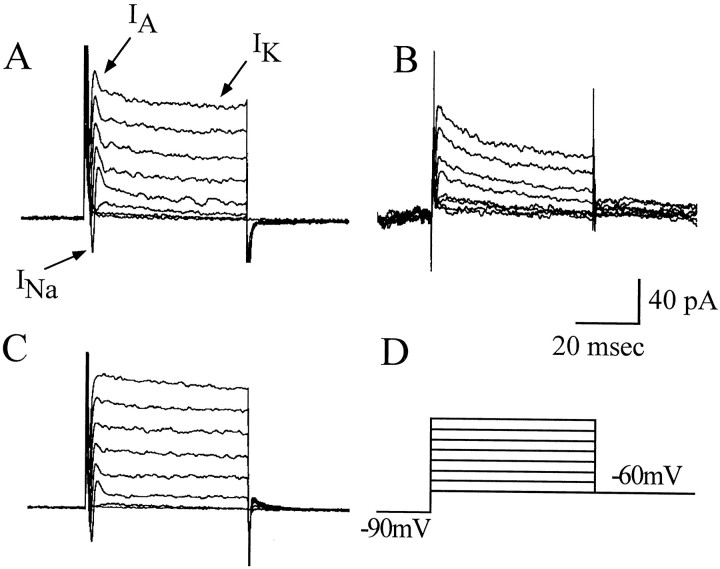
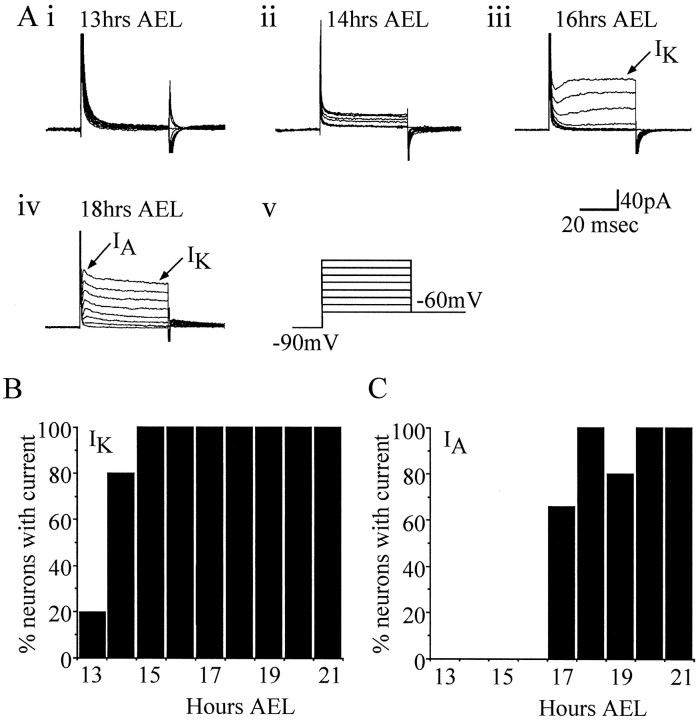
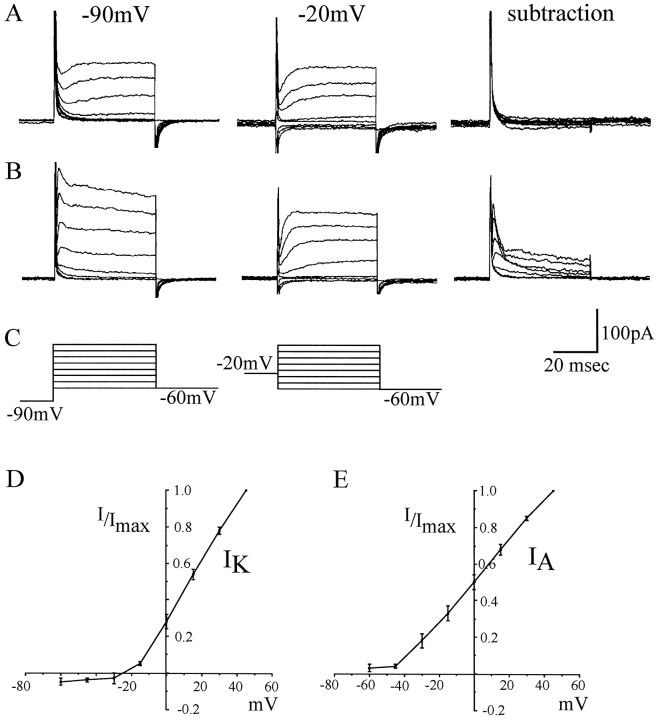
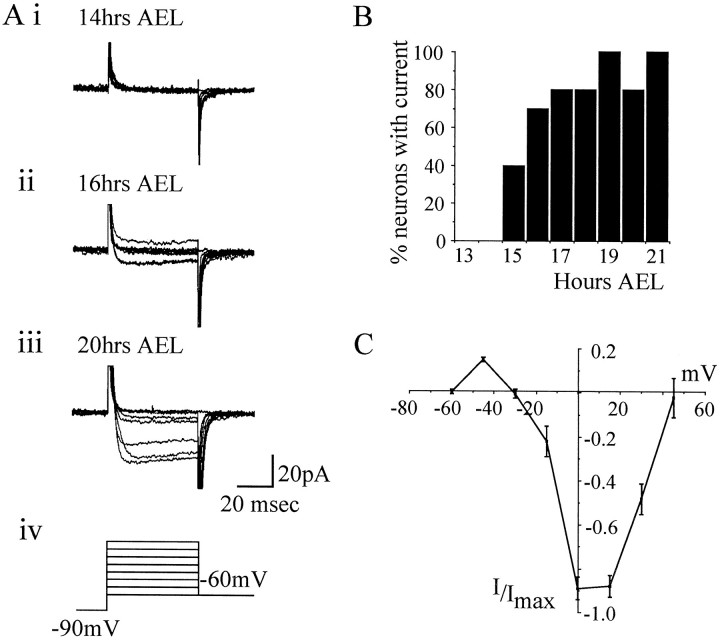
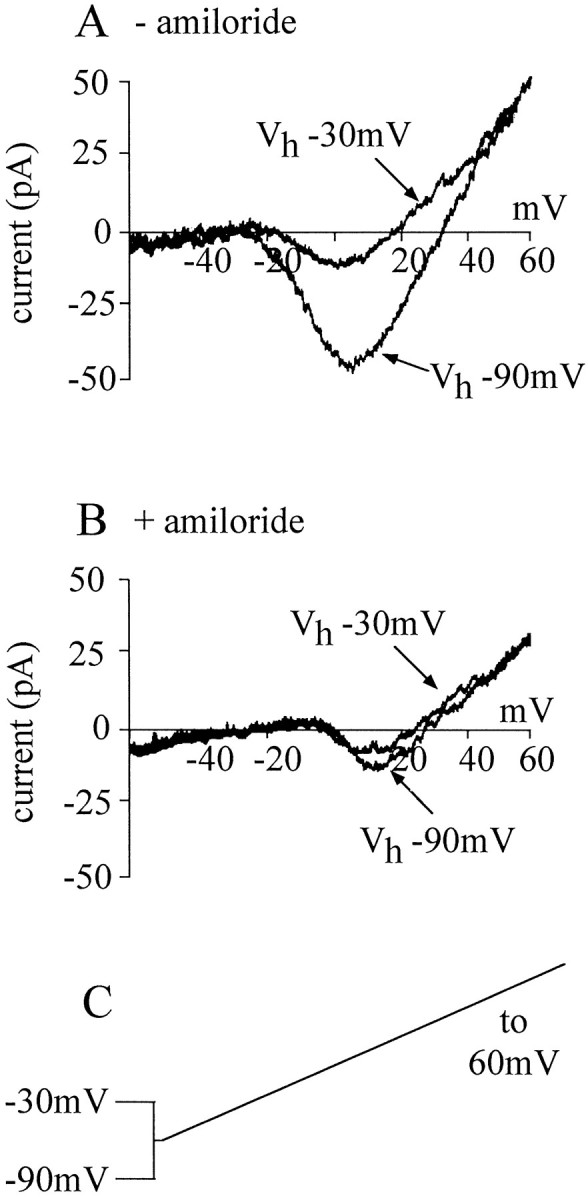
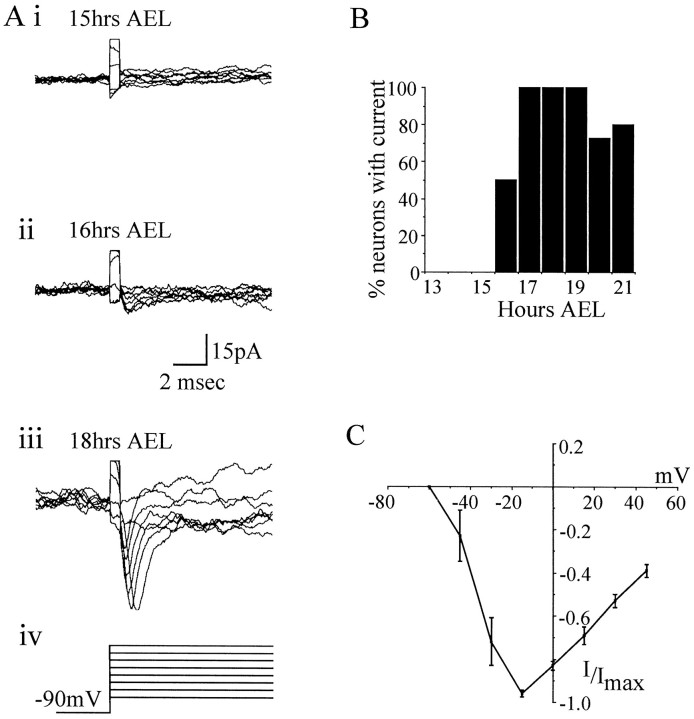
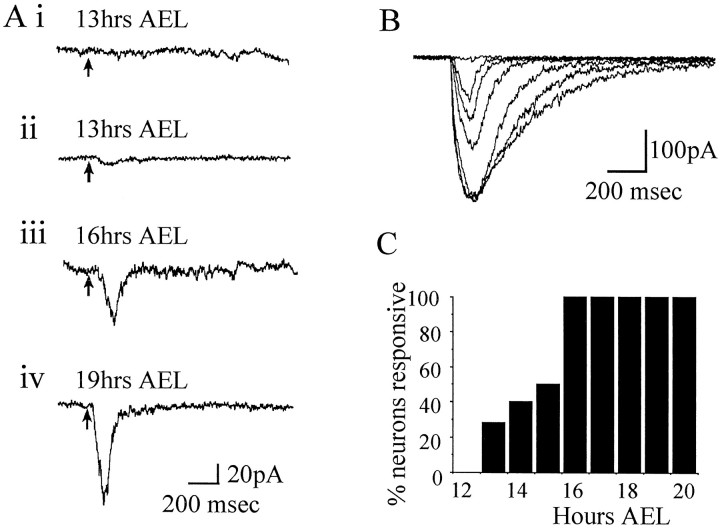
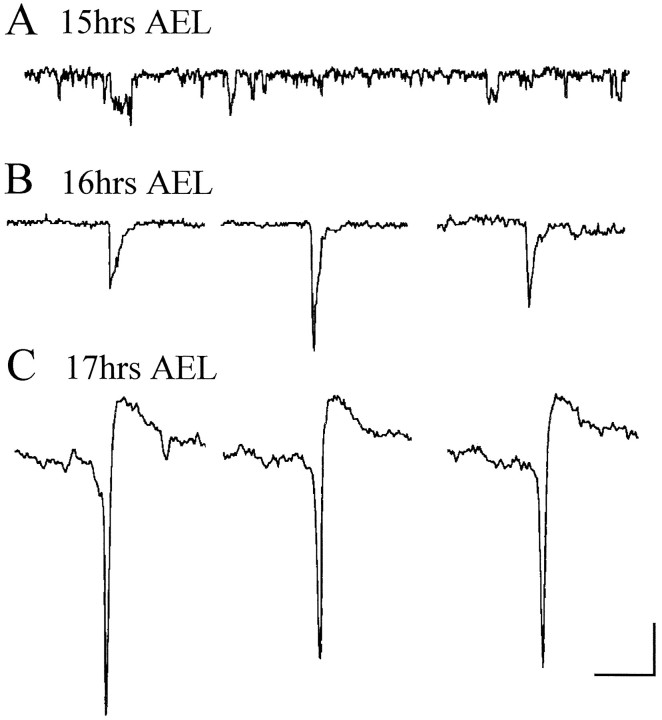
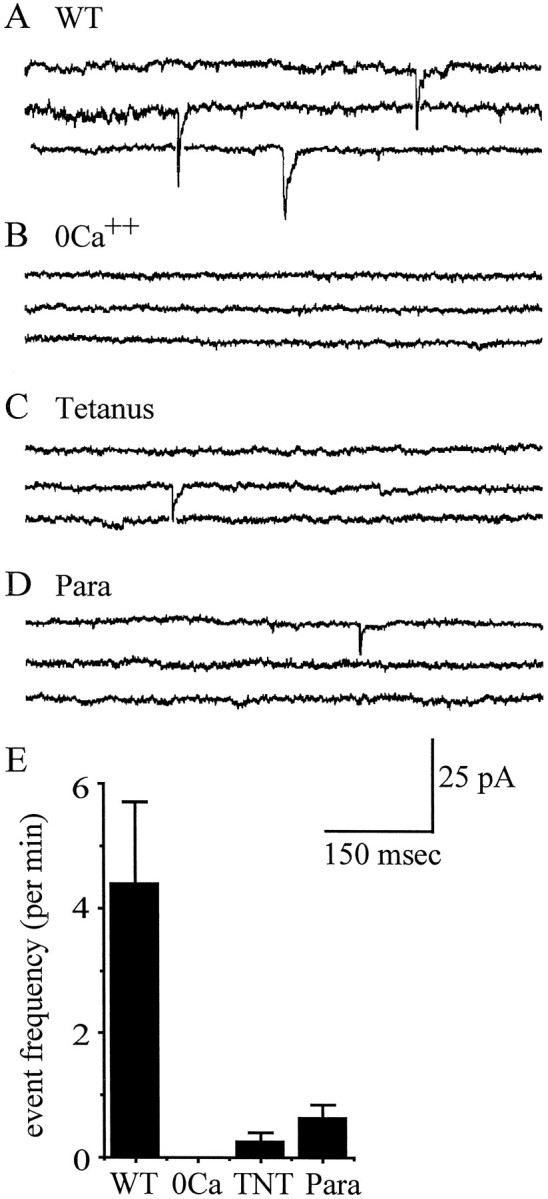
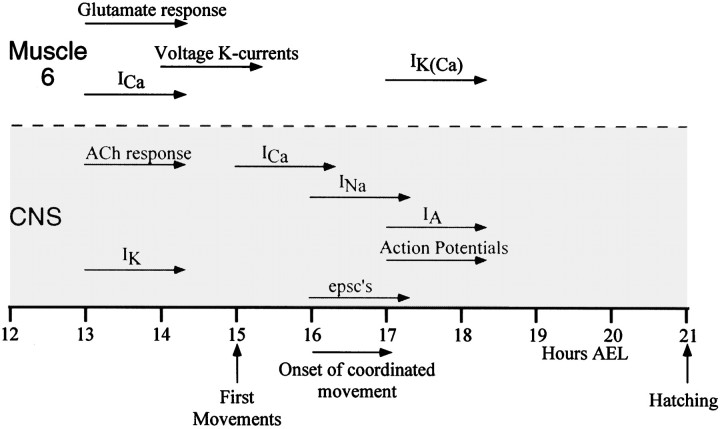
In this study, we describe the development of electrical properties of Drosophila embryonic central neurons in vivo. Using whole-cell voltage clamp, we describe the onset of expression of specific voltage- and ligand-gated ionic currents and the first appearance of endogenous and synaptic activity. The first currents occur during midembryogenesis [late stage 16, 13-14 hr after egg laying (AEL)] and consist of a delayed outward potassium current (IK) and an acetylcholine-gated inward cation current (IACh). As development proceeds, other voltage-activated currents arise sequentially. An inward calcium current (ICa) is first observed at 15 hr AEL, an inward sodium current (INa) at 16 hr AEL, and a rapidly inactivating outward potassium current (IA) at 17 hr AEL. The inward calcium current is composed of at least two individual and separable components that exhibit small temporal differences in their development. Endogenous activity is first apparent at 15 hr AEL and consists of small events (peak amplitude, 5 pA) that probably result from the random opening of relatively few numbers of ion channels. At 16 hr AEL, discrete (10-15 msec duration) currents that exhibit larger amplitude (25 pA maximum) and rapid activation but slower inactivation first appear. We identify these latter currents as EPSCs, an indication that functional synaptic transmission is occurring. In the neurons from which we record, action potentials first occur at 17 hr AEL. This study is the first to record from Drosophila embryonic central neurons in vivo and makes possible future work to define the factors that shape the electrical properties of neurons during development.


Figures

Fig. 1.
Fig. 1.
Current heterogeneity between neurons. Whole-cell voltage clamp shows the presence of at least two voltage-activated outward K currents and a voltage-activated inward Na current (INa) in developmentally mature neurons (19 hr AEL and older). K currents include a fast, inactivating A-type (IA) current and a slower, inactivating, delayed rectifier (IK)-like current. These neurons also express inward Ca currents, but these are masked by the outward K currents under the conditions used for these recordings (but see Fig.4). A, The majority of neurons examined exhibit prominent IA andIK currents. The remainder of neurons predominantly express either IA(B) or IK(C). INa is present in most but not all neurons (e.g., absent in B; see Fig.6). The presence or absence of INa appears unrelated to neuronal K current characteristics. D, Currents were evoked from voltage steps (15 mV increments; range, −60 to +45 mV; 50 msec) applied from a conditioning prepulse of −90 mV. Recordings were obtained in normal whole-cell saline (see Materials and Methods).
Fig. 2.
Fig. 2.
Voltage-activated potassium currents appear sequentially during development. A,IK is the first K current expressed during development and is first reliably observed at 14 hr AEL (ii). Before 14 hr AEL, most neurons exhibit only leakage currents (i, but see B). By 16 hr AEL, IK has increased in amplitude and is at this stage representative of its mature form (iii). At 17–18 hr AEL, the second voltage-activated K current (IA) is first seen (iv). Recordings were obtained in K conductance saline (see Materials and Methods), and voltage steps (15 mV increments; range, −60 to +45 mV; 50 msec) were applied from a conditioning prepulse of −90 mV (v). B,C, Beginning at 13 hr AEL, neuronal recordings were made to determine the presence or absence of each of the two K currents isolated using these conditions. Results shown are based on at least 10 (IK) and 9 (IA) neurons for each time point.
Fig. 3.
Fig. 3.
IK andIA can be separated by differences in voltage-dependent inactivation. A, Voltage-activated K currents evoked from different conditioning prepulses (−90 and −20 mV) at 16 hr AEL are essentially identical such that their subtraction from one another shows no evidence for any inactivating K-currents (which are inactivated by a prepulse to −20 mV). B, At 17 hr AEL when both IK andIA are present, a prepulse of −20 mV inactivates only IA-isolatingIK; subtraction yieldsIA. C, Recordings were obtained in K conductance saline (see Materials and Methods), and voltage steps (15 mV increments; range, −60 to +45 mV; 50 msec) were applied from conditioning prepulses of either −90 or −20 mV.D, E, Current–voltage relationships forIK and IAisolated by differential voltage-dependent inactivation. To overcome heterogeneity in current amplitude between individual neurons, currents are normalized to the maximum current (I) evoked at 45 mV in each neuron. Each point is the average of 13 (IK) or 14 (IA) determinations ± SE (average peak amplitude: IK, 64 ± 13 pA; IA, 141 ± 29 pA) from neurons 19–21 hr AEL.
Fig. 4.
Fig. 4.
Development of voltage-activated calcium current.A, Representative whole-cell currents showing the development of ICa during embryonic development. At 14 hr AEL, neurons do not express Ca currents (i). ICa is first observed at 15–16 hr AEL and thereafter increases in magnitude such that by late development (e.g., 19–21 hr AEL, iii)ICa is clearly visible in the majority of neurons examined (ii). Recordings were obtained in Ca conductance saline (see Materials and Methods), and voltage steps (15 mV increments; range, −60 to +45 mV; 50 msec) were applied from a conditioning prepulse of −90 mV (iv). All recordings use Ba as the permeant ion. Note that the small amount of outward current present in Aii is almost certainly attributable to an incomplete blockade of the voltage-activatedIK current. This outward current begins to become apparent because of the small size ofICa observed at this stage. At later stages of development, ICa is large enough to mask it completely. B, The presence or absence ofICa was determined during the second half of embryogenesis beginning at 13 hr AEL. Results shown are based on at least 10 neurons for each time point. C, Current–voltage relationship in mature embryos (19–21 hr AEL) showsICa activates above −30 mV, peaks at 0–15 mV, and reverses at ∼45 mV. Currents are normalized toImax. Each point is the average of 11 determinations ± SE (average peak amplitude, −34 ± 5 pA). Only recordings that showed a clear and graded voltage dependency ofICa were used.
Fig. 5.
Fig. 5.
At least two voltage-activated Ca currents are present in neurons. A, The voltage-activated Ca current can be visualized using a ramp protocol (shown in C). Depolarization inactivates a significant portion of this Ca current, indicating the presence of more than one current. B, In the presence of amiloride (1 mm), depolarization does not significantly reduce the whole-cell Ca current, showing that amiloride blocks that portion of current that can be inactivated by depolarization. C, Voltage ramps of −60 to +45 mV over 500 msec were applied from holding potentials of either −90 mV (normal) or −30 mV (depolarized). Currents shown in Aand B are from different neurons (19–21 hr AEL) and are representative of at least five separate experiments.
Fig. 6.
Fig. 6.
Development of voltage-activated sodium current.A, Representative whole-cell currents showing the development of INa during embryogenesis. At 15 hr AEL, INa is not present in neuronal recordings (i). INa is first observed at 16 hr AEL, although at this stage its amplitude is small (ii). As development continues,INa increases in size such that by late development (18–21 hr AEL,) it is clearly visible in the majority of neurons examined (iii). Recordings were made in Na conductance saline (see Materials and Methods), and voltage steps (15 mV increments; range, −60 to +45 mV; 50 msec) were applied from a conditioning prepulse of −90 mV (iv). Currents were leak-subtracted on-line using a P/4 protocol. B, The presence or absence of INa was determined throughout mid to late embryogenesis. Results shown are based on at least 10 neurons for each time point. C, Current–voltage relationship in mature embryos (19–21 hr AEL) shows that INa activates between −60 and −45 mV and reaches its maximum amplitude at approximately −15 mV. Currents are normalized to Imax. Each point is the average of 11 determinations ± SE (average peak amplitude, −47 ± 7 pA). Only recordings that showed a clear and graded voltage dependency of INa were used.
Fig. 7.
Fig. 7.
Development of an ACh-gated current.A, At 13 hr AEL, the majority of neurons do not respond to applied ACh (i); the minority respond to applied ACh by exhibiting a weak and slow inward current (ii). By 16 hr AEL, all neurons tested responded to ACh (iii). The inward current evoked at this stage displays markedly increased amplitude and kinetics. As development continues, the ACh-evoked current increases further in amplitude and in rate of onset (iv). Recordings were obtained in normal whole-cell saline (see Materials and Methods) and neurons were held under voltage clamp at −60 mV. ACh was applied to the neurons by iontophoresis using an ejection current of +30 nA (a saturating level; see B). B, Application of ACh by iontophoresis shows a clear dose-dependent response relative to the amplitude of ejection current. The responses shown are evoked by an increasing series of ejection currents (1, 2.5, 5, 10, 20, 30, and 40 nA) applied at 30 sec intervals to a neuron 21 hr AEL that responded particularly strongly. The response saturates at an ejection current amplitude of ≥20 nA, and no response is evoked by 1 nA. Ejection current of opposite sign (i.e., hyperpolarizing) evoked no response (data not shown). C, The effect of ACh was determined during embryogenesis beginning at 13 hr AEL. Determinations were made at each successive hour in development, and the results shown are based on at least six neurons for each time point.
Fig. 8.
Fig. 8.
Development of endogenous neuronal activity.A, At 15 hr AEL whole-cell recordings reveal small inward currents that exhibit characteristics of single channel activity. B, Inward currents that resemble EPSCs are first observed in neurons at 16 hr AEL. These currents, which can reach 25pA in amplitude, have a rapid onset but slower decay and persist for ∼10–15 msec. C, Endogenous currents that are attributable to the generation and spread of action potentials in neurons are first observed at 17 hr AEL. These currents are relatively large (some exceeding 50 pA), are brief (3–5 msec), and overshoot. ForB and C, three representative examples from three individual neurons are shown. Neurons are voltage-clamped at −60 mV (A, B) and −40 mV (C) in normal whole-cell saline. Calibration:A, 2.5 pA, 40 msec; B, C, 10 pA, 20 msec.
Fig. 9.
Fig. 9.
Characterization of EPSC-like currents.A, Neuronal recordings from wild-type (WT) embryos show currents that we classify as EPSCs (see Fig. 8). B, In conditions of 0 Ca2+–high Mg2+ (20 mm) known to prevent evoked release of neurotransmitter, no such currents are observed, supporting our identification of these events as resulting from the evoked release of synaptic neurotransmitter. C, Disruption of synaptic release by the expression of tetanus toxin light chain (TNT) in all neurons of the CNS (see Results) markedly reduces both frequency and amplitude of these currents. D, In embryos that carry a deficiency for para and cannot therefore support sodium-based action potentials, these events are also, as expected for evoked synaptic currents, severely reduced in both frequency and amplitude. E, Average frequency ± SE of EPSC-like currents per minute, determined from 3 min recordings from five separate motoneurons for each category. All three treatments are significantly different from WT at p< 0.05 (Mann–Whitney U test). Neurons are voltage-clamped at −60 mV in normal whole-cell saline.
Fig. 10.
Fig. 10.
Summary of the electrophysiological development of Drosophila embryonic neurons. The development of electrical properties of embryonic central neurons are shown with published data summarizing the development of the electrical properties of an identified body wall muscle (muscle 6) (Broadie and Bate, 1993).Bars show the onset of each current, andarrowheads show that the currents continue throughout the rest of development in the direction shown. The first appearance of both a voltage- and a ligand-gated current (IK andIACh) in central neurons coincides with the onset of currents in muscle. However, the ionic nature of the currents first observed in neurons differs from those in muscle 6.

References

    1. Aisemberg GO, Gershon TR, Macagno ER. New electrical properties of neurons induced by a homeoprotein. J Neurobiol. 1997;33:11–17. - PubMed
    1. Baines RA, Bacon JP. Pharmacological analysis of the cholinergic input to the locust VPLI neuron from an extraocular photoreceptor system. J Neurophysiol. 1994;72:2864–2874. - PubMed
    1. Baker K, Salkoff L. The Drosophila shaker gene codes for a distinctive K+ current in a subset of neurons. Neuron. 1990;2:129–140. - PubMed
    1. Benson JA. Electrophysiological pharmacology of the nicotinic and muscarinic cholinergic responses of isolated neuronal somata from locust thoracic ganglia. J Exp Biol. 1992;170:203–233.
    1. Blagburn JM, Sosa MA, Blanco RE. Specificity of identified central synapses in the embryonic cockroach: appropriate connections form before the onset of spontaneous afferent activity. J Comp Neurol. 1996;373:511–528. - PubMed

Publication types

LinkOut - more resources