

The gastrulation defective gene of Drosophila melanogaster is a member of the serine protease superfamily
- PMID: 9618496
- PMCID: PMC22648
- DOI: 10.1073/pnas.95.12.6819
The gastrulation defective gene of Drosophila melanogaster is a member of the serine protease superfamily
Abstract
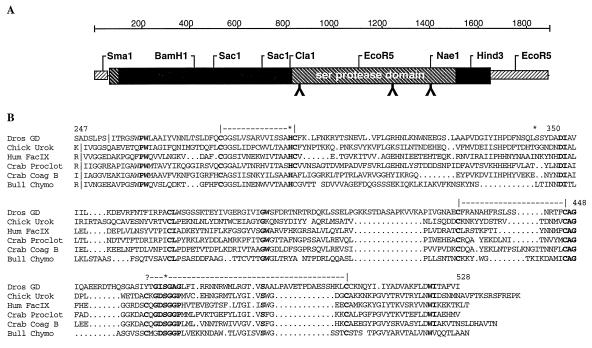
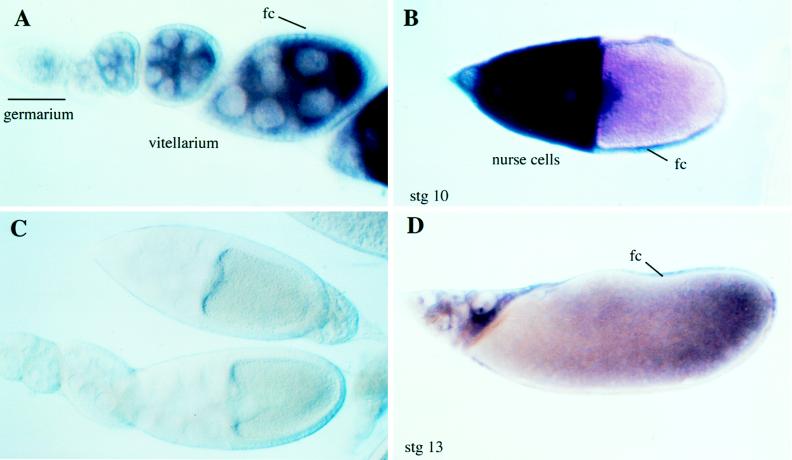
The establishment of dorsal-ventral polarity in the oocyte involves two sets of genes. One set belongs to the gurken-torpedo signaling pathway and affects the development of the egg chorion as well as the polarity of the embryo. The second set of genes affects only the dorsal-ventral polarity of the embryo but not the eggshell. gastrulation defective is one of the earliest acting of this second set of maternally required genes. We have cloned and characterized the gastrulation defective gene and determined that it encodes a protein structurally related to the serine protease superfamily, which also includes the Snake, Easter, and Nudel proteins. These data provide additional support for the involvement of a protease cascade in generating an asymmetric signal (i.e., asymmetric Spätzle activity) during establishment of dorsal-ventral polarity in the Drosophila embryo.
Figures
Similar articles
-
Gastrulation defective, a complement factor C2/B-like protease, interprets a ventral prepattern in Drosophila.EMBO Rep. 2001 Aug;2(8):721-6. doi: 10.1093/embo-reports/kve153. EMBO Rep. 2001. PMID: 11493599 Free PMC article.
-
No requirement for localized Nudel protein expression in Drosophila embryonic axis determination.Fly (Austin). 2008 Jul-Aug;2(4):220-8. doi: 10.4161/fly.6794. Fly (Austin). 2008. PMID: 18776742 Free PMC article.
-
Localized serine protease activity and the establishment of Drosophila embryonic dorsoventral polarity.Fly (Austin). 2013 Jul-Sep;7(3):161-7. doi: 10.4161/fly.25141. Epub 2013 Jun 10. Fly (Austin). 2013. PMID: 24047959 Free PMC article.
-
Signaling pathways that establish the dorsal-ventral pattern of the Drosophila embryo.Annu Rev Genet. 1995;29:371-99. doi: 10.1146/annurev.ge.29.120195.002103. Annu Rev Genet. 1995. PMID: 8825480 Review.
-
Maternal control of the Drosophila dorsal-ventral body axis.Wiley Interdiscip Rev Dev Biol. 2014 Sep-Oct;3(5):301-30. doi: 10.1002/wdev.138. Epub 2014 May 29. Wiley Interdiscip Rev Dev Biol. 2014. PMID: 25124754 Free PMC article. Review.
Cited by
-
Gastrulation defective, a complement factor C2/B-like protease, interprets a ventral prepattern in Drosophila.EMBO Rep. 2001 Aug;2(8):721-6. doi: 10.1093/embo-reports/kve153. EMBO Rep. 2001. PMID: 11493599 Free PMC article.
-
Ovochymase, a Xenopus laevis egg extracellular protease, is translated as part of an unusual polyprotease.Proc Natl Acad Sci U S A. 1999 Sep 28;96(20):11253-8. doi: 10.1073/pnas.96.20.11253. Proc Natl Acad Sci U S A. 1999. PMID: 10500163 Free PMC article.
-
Gastrulation defective is a serine protease involved in activating the receptor toll to polarize the Drosophila embryo.Proc Natl Acad Sci U S A. 2000 Aug 1;97(16):9093-7. doi: 10.1073/pnas.97.16.9093. Proc Natl Acad Sci U S A. 2000. PMID: 10922064 Free PMC article.
-
Trans regulation of an odorant binding protein by a proto-Y chromosome affects male courtship in house fly.Elife. 2024 Oct 18;13:e90349. doi: 10.7554/eLife.90349. Elife. 2024. PMID: 39422654 Free PMC article.
-
No requirement for localized Nudel protein expression in Drosophila embryonic axis determination.Fly (Austin). 2008 Jul-Aug;2(4):220-8. doi: 10.4161/fly.6794. Fly (Austin). 2008. PMID: 18776742 Free PMC article.
References
-
- Morisato D, Anderson K V. Annu Rev Genet. 1995;29:371–399. - PubMed
-
- Ray R P, Schupbach T. Genes Dev. 1996;10:1711–1723. - PubMed
-
- Hashimoto C, Hudson K L, Anderson K V. Cell. 1988;52:269–279. - PubMed
-
- Hashimoto C, Gerttula S, Anderson K V. Development (Cambridge, UK) 1991;111:1021–1028. - PubMed
-
- Morisato D, Anderson K V. Cell. 1994;76:677–688. - PubMed
Publication types
MeSH terms
Substances
Associated data
- Actions
Grants and funding
LinkOut - more resources
Full Text Sources
Molecular Biology Databases
