. 1998 Jun 9;95(12):6930-5.
doi: 10.1073/pnas.95.12.6930.

T1/ST2 is preferentially expressed on murine Th2 cells, independent of interleukin 4, interleukin 5, and interleukin 10, and important for Th2 effector function

Affiliations

T1/ST2 is preferentially expressed on murine Th2 cells, independent of interleukin 4, interleukin 5, and interleukin 10, and important for Th2 effector function

M Löhning et al. Proc Natl Acad Sci U S A. .

Abstract

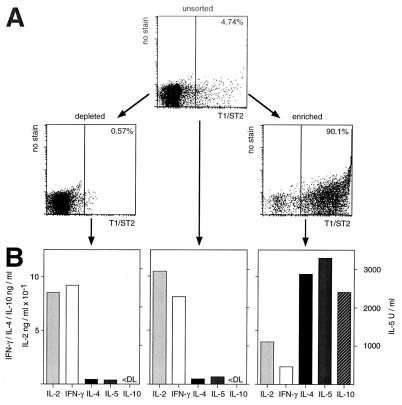
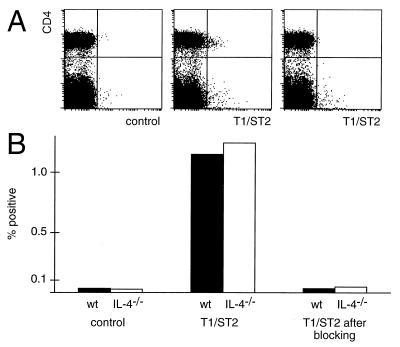
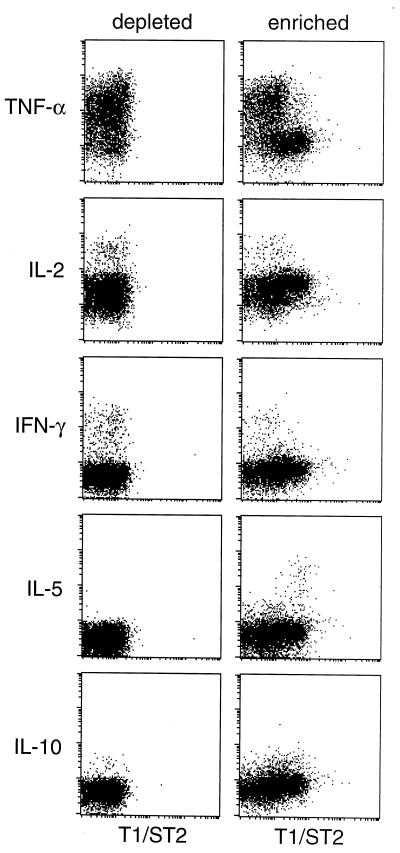
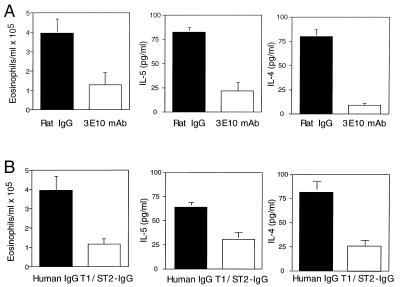
T helper (Th) cells can be categorized according to their cytokine expression. The differential induction of Th cells expressing Th1 and/or Th2 cytokines is key to the regulation of both protective and pathological immune responses. Cytokines are expressed transiently and there is a lack of stably expressed surface molecules, significant for functionally different types of Th cells. Such molecules are of utmost importance for the analysis and selective functional modulation of Th subsets and will provide new therapeutic strategies for the treatment of allergic or autoimmune diseases. To this end, we have identified potential target genes preferentially expressed in Th2 cells, expressing interleukin (IL)-4, IL-5, and/or IL-10, but not interferon-gamma. One such gene, T1/ST2, is expressed stably on both Th2 clones and Th2-polarized cells activated in vivo or in vitro. T1/ST2 expression is independent of induction by IL-4, IL-5, or IL-10. T1/ST2 plays a critical role in Th2 effector function. Administration of either a mAb against T1/ST2 or recombinant T1/ST2 fusion protein attenuates eosinophilic inflammation of the airways and suppresses IL-4 and IL-5 production in vivo following adoptive transfer of Th2 cells.


Figures

Figure 1
Figure 1
Cytokine production of T1/ST2+ Th cells in vitro. (A) Spleen cells from DO11.10 TCR-transgenic mice were primed in vitro in the presence or absence of IL-4 and anti-IL-12. One week later, the T cells were restimulated in vitro with peptide and antigen-presenting cells. Again, one culture received IL-4 and anti-IL-12 for further Th2 polarization, whereas the other culture did not receive additional cytokines. Ten days later, Th cells from both cultures were mixed, stained with anti-T1/ST2 mAb using magnetofluorescent liposomes, and sorted by MACS. Percentages of T1/ST2+ cells are indicated. (B) Unsorted cells and the T1/ST2-enriched or -depleted fractions were stimulated with PMA/ionomycin. Twenty-four hours later the cytokine concentrations in the culture supernatants were determined by ELISA. Values for IL-10 in the unsorted and depleted cell fractions were below the detection limit (<DL) of 0.5 ng/ml.
Figure 2
Figure 2
Expression of T1/ST2 on spleen cells ex vivo. Spleen cells from BALB/c mice were stained with digoxigenized mAb against T1/ST2 (3E10), followed by Cy5-conjugated anti-DIG and PE- or FITC-conjugated mAbs against either CD4, CD8, CD45R, CD11b, or CD11c. B6 spleens were used for the detection of NK1.1+ cells. Gates were set on viable cells according to forward and sideward scatter and exclusion of propidium iodide-binding particles. All samples were incubated with blocking anti-Fcγ-R mAb and purified rat IgG before and during staining with 3E10. Up to 106 cells were acquired to allow depiction of ≈5,000 cells of each leukocyte subset in the upper quadrants of each dot plot. The percentages shown indicate the frequency of T1/ST2+ cells within the different leukocyte subpopulations. (A) Anti-DIG-Cy5 antibody alone. The specificity of the staining for T1/ST2 shown in B was controlled by preincubation of the cells with a 100-fold excess of unconjugated 3E10 as shown in C.
Figure 3
Figure 3
Antigen-experienced but not naive Th cells express T1/ST2. Spleen cells from BALB/c mice were stained with mAbs against T1/ST2, CD4, and CD62L. Gates were set on viable cells according to forward and sideward scatter and exclusion of propidium iodide-binding particles. By gating on CD62Lhi or CD62Llo CD4+ cells, histograms for 3E10 staining were obtained.
Figure 4
Figure 4
Cytokine production of T1/ST2+ cells ex vivo. T1/ST2+ lymphocytes from spleens and lymph nodes of BALB/c mice were enriched by MACS. Enriched and depleted cell fractions were stimulated for 5 hr with PMA/ionomycin, fixed, and stained for CD4 and intracellular cytokines. For analysis, gates were set on CD4+ lymphocytes. Equal numbers of CD4+ cells are depicted in each dot plot.
Figure 5
Figure 5
T1/ST2+ cells in IL-4−/− mice. (A) Spleen cells from wt and IL-4−/− BALB/c mice were stained with mAbs against T1/ST2, CD4, and CD62L as described for Fig. 2. The control panel shows the fluorescence signal of anti-DIG-Cy5 alone. To verify its specificity, the staining of 3E10 was blocked by preincubation of the cells with a 100-fold excess of unconjugated 3E10, which reduced the subsequent 3E10 staining on CD4+ cells to control levels in both wt and IL-4−/− mice. The dot plots represent the results obtained with IL-4−/− mice. (For wt BALB/c mice see Fig. 2.) (B) Frequency of T1/ST2+ cells among CD4+ cells from wt and IL-4−/− mice, as determined in A.
Figure 6
Figure 6
Cytokine production of T1/ST2+ cells from IL-4−/− mice ex vivo. Lymphocytes from spleens of IL-4−/− mice were stained with anti-T1/ST2 mAb and sorted by MACS. Enriched and depleted cell fractions were stimulated for 5 hr with PMA/ionomycin, fixed, and stained for CD4 and intracellular cytokines. For analysis, gates were set on CD4+ lymphocytes. Equal numbers of CD4+ cells are depicted in each dot plot.
Figure 7
Figure 7
Inhibition of Th2 effector function in vivo. Th2-recipient mice were exposed to OVA aerosols. Twenty-four hours after the last aerosol challenge BAL was performed, and differential cell counts and cytokine ELISA were done. (A) Mice received either T1/ST2-specific mAb 3E10 (open bars) or rat IgG as isotype control (solid bars) 1 hr before OVA challenge. (B) Mice received either T1/ST2–IgG fusion protein (open bars) or human IgG (solid bars). Data are shown as the mean ± SEM of 4–6 animals.

Similar articles

Cited by

References

    1. Abbas A K, Murphy K M, Sher A. Nature (London) 1996;383:787–793. - PubMed
    1. Mosmann T R, Sad S. Immunol Today. 1996;17:138–146. - PubMed
    1. Klemenz R, Hoffmann S, Werenskiold A K. Proc Natl Acad Sci USA. 1989;86:5708–5712. - PMC - PubMed
    1. Tominaga S. FEBS Lett. 1989;258:301–304. - PubMed
    1. Kumar S, Minnich M D, Young P R. J Biol Chem. 1995;270:27905–27913. - PubMed

Publication types

LinkOut - more resources