. 1998 Jun 9;95(12):7127-32.
doi: 10.1073/pnas.95.12.7127.

Acoustic overstimulation increases outer hair cell Ca2+ concentrations and causes dynamic contractions of the hearing organ

Affiliations

Acoustic overstimulation increases outer hair cell Ca2+ concentrations and causes dynamic contractions of the hearing organ

A Fridberger et al. Proc Natl Acad Sci U S A. .

Abstract

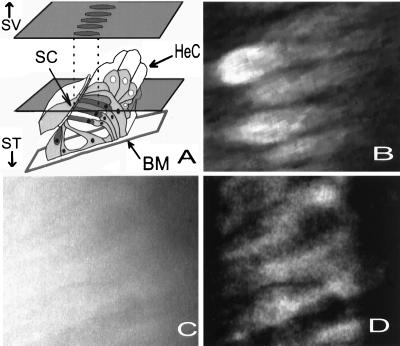
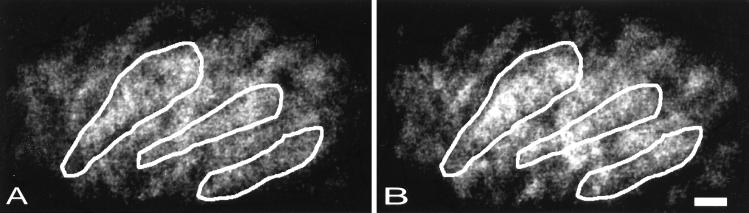
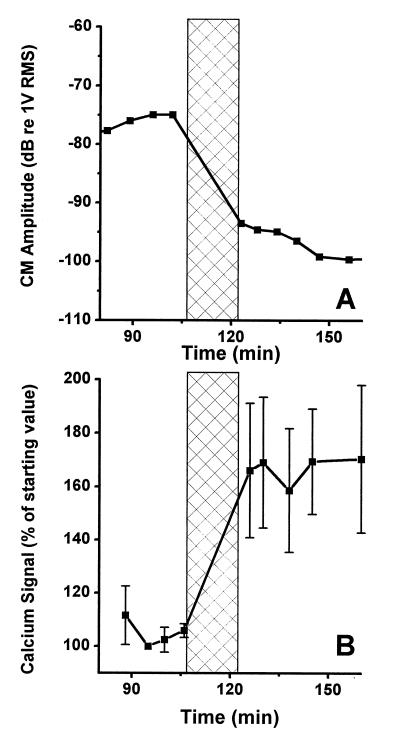
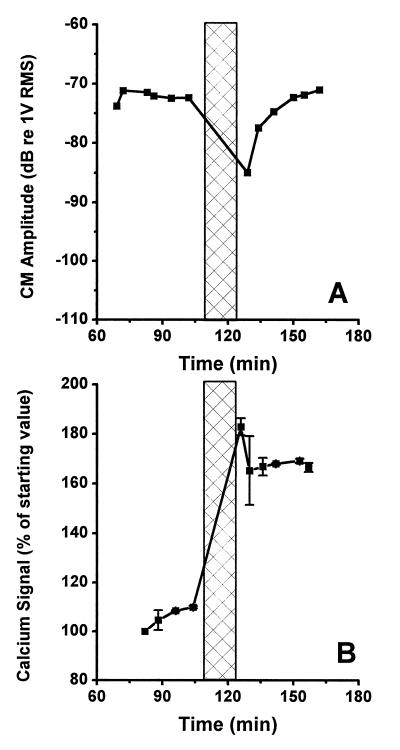
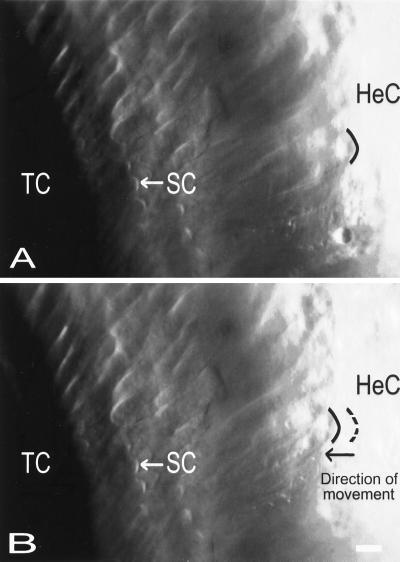
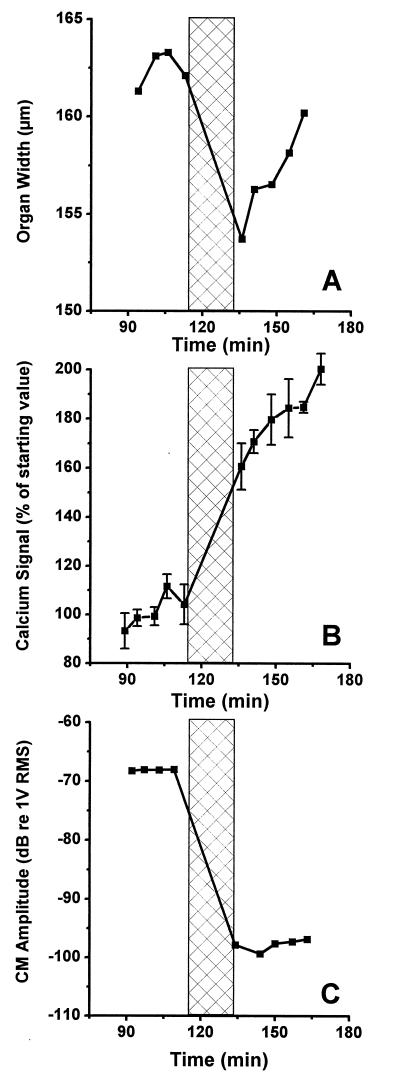
The dynamic responses of the hearing organ to acoustic overstimulation were investigated using the guinea pig isolated temporal bone preparation. The organ was loaded with the fluorescent Ca2+ indicator Fluo-3, and the cochlear electric responses to low-level tones were recorded through a microelectrode in the scala media. After overstimulation, the amplitude of the cochlear potentials decreased significantly. In some cases, rapid recovery was seen with the potentials returning to their initial amplitude. In 12 of 14 cases in which overstimulation gave a decrease in the cochlear responses, significant elevations of the cytoplasmic [Ca2+] in the outer hair cells were seen. [Ca2+] increases appeared immediately after terminating the overstimulation, with partial recovery taking place in the ensuing 30 min in some preparations. Such [Ca2+] changes were not seen in preparations that were stimulated at levels that did not cause an amplitude change in the cochlear potentials. The overstimulation also gave rise to a contraction, evident as a decrease of the width of the organ of Corti. The average contraction in 10 preparations was 9 microm (SE 2 microm). Partial or complete recovery was seen within 30-45 min after the overstimulation. The [Ca2+] changes and the contraction are likely to produce major functional alterations and consequently are suggested to be a factor contributing strongly to the loss of function seen after exposure to loud sounds.


Figures

Figure 1
Figure 1
(A) Schematic drawing of the organ of Corti in the apical turn of the guinea pig cochlea, made from light and electron microscopic images. The plane of section through the organ seen in B–D is indicated by the plane through the figure. By tilting the preparation, the cell bodies of the OHCs were visualized. During the experiments, the organ was viewed from the scala vestibuli (SV) side. ST, direction of the scala vestibuli; BM, basilar membrane. Hair cells dark gray. (B) Confocal microscope image. (C) Fluorescence image. See text for explanations. (D) Fig. 1C after processing with the no–neighbors algorithm.
Figure 2
Figure 2
(A) A group of OHCs in the apical turn loaded with Fluo-3. (B) the same group of cells after being subjected to acoustic overstimulation. (Scale bar: 10 μm.)
Figure 3
Figure 3
(A) Recording of the CM amplitude before and after acoustic overstimulation. The overstimulation period is indicated by the crossed region. (B) Ca2+-dependent fluorescence in the same preparation as shown in A. Vertical bars centered on each point give the SE. The overstimulation resulted in a 60% increase of the fluorescence.
Figure 4
Figure 4
(A) Overstimulation resulted in a transient decrease of the amplitude of the CM in this preparation, but the amplitude returned to the prestimulus level in 21 min after ending the stimulus. (B) Fluorescence measurement from the same preparation. After the termination of the stimulus period, partial recovery was seen.
Figure 5
Figure 5
Photomicrographs showing the surface of the organ of Corti in the apical turn. The HeC can be seen in the Right part of the image; the characteristic lipid droplets inside their cytoplasm being evident as the round structures. The tunnel of Corti (TC) is to the left, and immediately to the right of the tunnel, the first row of OHCs is seen. The arrows indicate the location of the characteristically V-shaped hair bundle (SC) of a second row outer hair cell. (A) Before overstimulation. (B) After overstimulation. The result of the stimulus was a contraction of the organ. The position of the SC remained constant, but the HeC moved in the direction of the tunnel of Corti. The contraction was associated with a 10 dB decrease of the CM and an increase of the [Ca2+]. (Bar = 10 μm.)
Figure 6
Figure 6
(A) Measurement of the width of the hearing organ before and after overstimulation. A large contraction followed the noxious stimuli, with full recovery occurring in the subsequent 25 min (B) Ca2+-dependent fluorescence from the same preparation. (C) Measurement of the CM amplitude in response to an 88-dB SPL stimulus before and after overstimulation.

References

    1. Saunders J C, Cohen Y E, Szymko Y M. J Acoust Soc Am. 1991;90:136–146. - PubMed
    1. Liberman M C, Dodds L W. Hear Res. 1984;16:55–74. - PubMed
    1. Tilney L G, Saunders J C, Egelman E, DeRosier D J. Hear Res. 1982;7:181–197. - PubMed
    1. Hamernik R P, Patterson J H, Turrentine G A, Ahroon W A. Hear Res. 1989;38:199–212. - PubMed
    1. Cody A R, Russell I J. Nature (London) 1985;315:662–665. - PubMed

Publication types

LinkOut - more resources