

Molecular typing of environmental and patient isolates of Aspergillus fumigatus from various hospital settings
- PMID: 9620367
- PMCID: PMC104867
- DOI: 10.1128/JCM.36.6.1494-1500.1998
Molecular typing of environmental and patient isolates of Aspergillus fumigatus from various hospital settings
Abstract
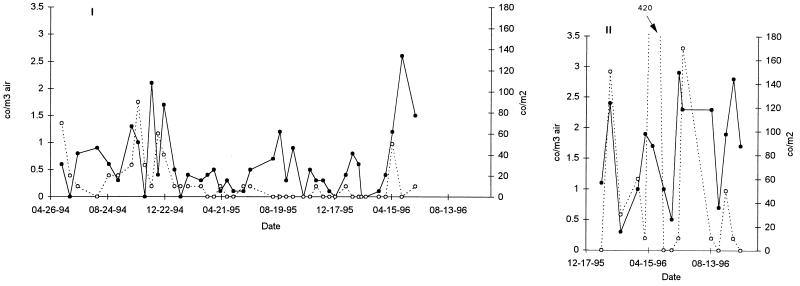
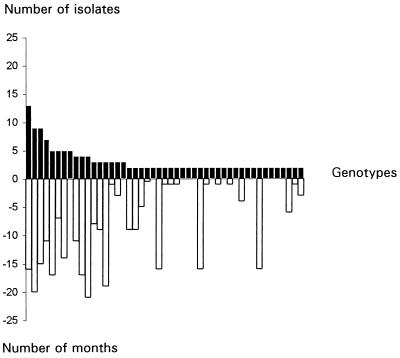
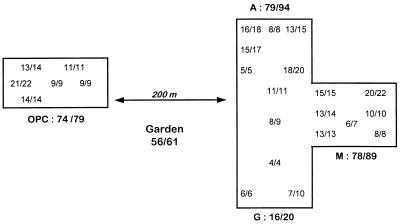
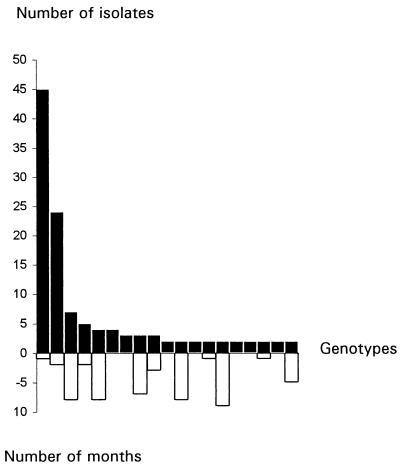
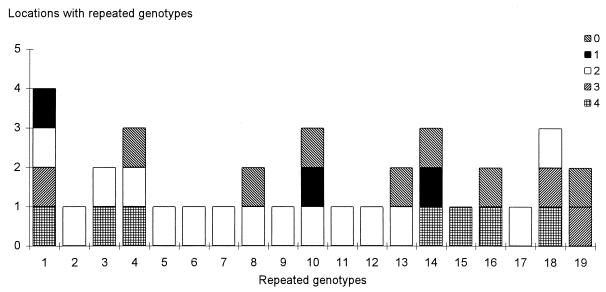
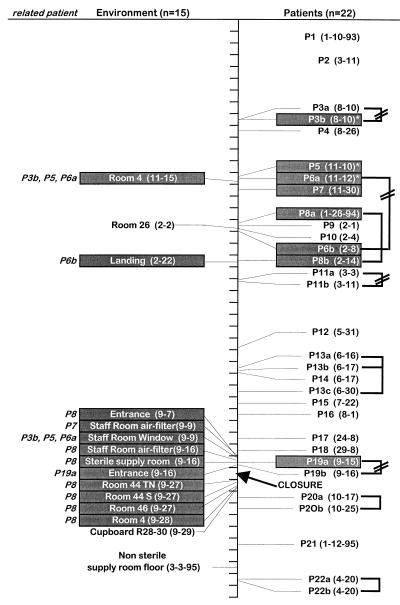
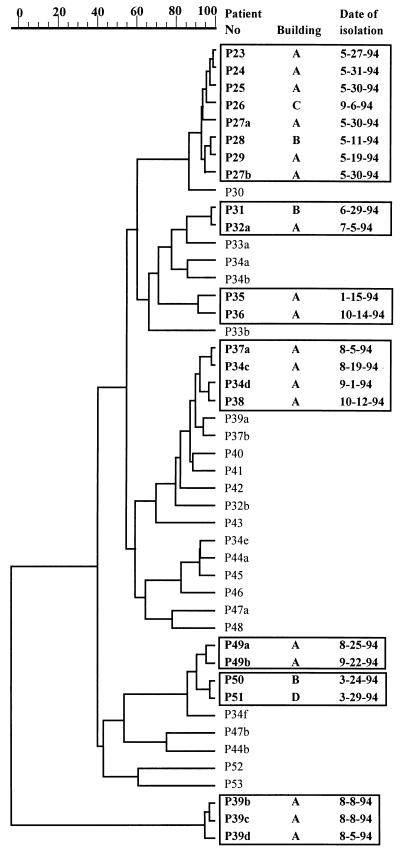
Fingerprinting of more than 700 clinical and environmental isolates of Aspergillus fumigatus from four differential hospital settings was undertaken with a dispersed repeated DNA sequence. The analysis of the environmental isolates showed that the airborne A. fumigatus population is extremely diverse, with 85% of the strains being represented as a single genotype isolated once. The remaining 15% of the strains were isolated several times and were able to persist for several months in the same hospital environment. No strains were found to be associated with a specific location inside the hospital, and identical strains were isolated from different buildings of the hospital and outdoors. Isolation of the same strain both from patients and from the environment of the same hospital is highly suggestive of a nosocomial infection. The characteristics of the environmental fungal population explains the two main results obtained from the typing of the clinical isolates: (i) the absence of a common strain responsible for an invasive aspergillosis outbreak results from the extreme diversity of the environmental population of A. fumigatus in contact with the patients, and (ii) patients hospitalized in different wards of the same hospital can be infected with the same strain since every patient might inhale the same spore population.
Figures
Similar articles
-
Microsatellite typing of Aspergillus fumigatus isolates recovered from deep organ samples of patients with invasive aspergillosis.Diagn Microbiol Infect Dis. 2008 Sep;62(1):96-8. doi: 10.1016/j.diagmicrobio.2008.04.006. Epub 2008 May 22. Diagn Microbiol Infect Dis. 2008. PMID: 18501550
-
Epidemiological study of invasive pulmonary aspergillosis in a haematology unit by molecular typing of environmental and patient isolates of Aspergillus fumigatus.J Hosp Infect. 2005 May;60(1):61-8. doi: 10.1016/j.jhin.2004.10.009. J Hosp Infect. 2005. PMID: 15823659
-
Molecular epidemiology of apparent outbreak of invasive aspergillosis in a hematology ward.J Clin Microbiol. 1996 Feb;34(2):345-51. doi: 10.1128/jcm.34.2.345-351.1996. J Clin Microbiol. 1996. PMID: 8789013 Free PMC article.
-
Molecular diagnosis and epidemiology of fungal infections.Med Mycol. 1998;36 Suppl 1:249-57. Med Mycol. 1998. PMID: 9988514 Review.
-
A new experimental murine aspergillosis model to identify strains of Aspergillus fumigatus with reduced virulence.Nihon Ishinkin Gakkai Zasshi. 2002;43(4):203-13. doi: 10.3314/jjmm.43.203. Nihon Ishinkin Gakkai Zasshi. 2002. PMID: 12402022 Review.
Cited by
-
MDA5 Is an Essential Sensor of a Pathogen-Associated Molecular Pattern Associated with Vitality That Is Necessary for Host Resistance against Aspergillus fumigatus.J Immunol. 2020 Dec 1;205(11):3058-3070. doi: 10.4049/jimmunol.2000802. Epub 2020 Oct 21. J Immunol. 2020. PMID: 33087405 Free PMC article.
-
Molecular epidemiology of Aspergillus fumigatus: an in-depth genotypic analysis of isolates involved in an outbreak of invasive aspergillosis.J Clin Microbiol. 2011 Oct;49(10):3498-503. doi: 10.1128/JCM.01159-11. Epub 2011 Aug 10. J Clin Microbiol. 2011. PMID: 21832010 Free PMC article.
-
Aspergillus fumigatus and aspergillosis.Clin Microbiol Rev. 1999 Apr;12(2):310-50. doi: 10.1128/CMR.12.2.310. Clin Microbiol Rev. 1999. PMID: 10194462 Free PMC article. Review.
-
Surrogate infection model predicts optimal alveolar macrophage number for clearance of Aspergillus fumigatus infections.NPJ Syst Biol Appl. 2023 Apr 10;9(1):12. doi: 10.1038/s41540-023-00272-x. NPJ Syst Biol Appl. 2023. PMID: 37037824 Free PMC article.
-
Global Sexual Fertility in the Opportunistic Pathogen Aspergillus fumigatus and Identification of New Supermater Strains.J Fungi (Basel). 2020 Oct 30;6(4):258. doi: 10.3390/jof6040258. J Fungi (Basel). 2020. PMID: 33143051 Free PMC article.
References
-
- Aisner J, Murillo J, Schimpff S C, Steere A C. Invasive aspergillosis in acute leukemia: correlation with nose cultures and antibiotic use. Ann Intern Med. 1979;90:4–9. - PubMed
-
- Aisner J, Schimpff S C, Bennett J E, Young V M, Wiernik P H. Aspergillus infections in cancer patients: association with fire proofing materials in a new hospital. JAMA. 1976;235:411–412. - PubMed
-
- Albelda S M, Talbot G H, Gerson S L, Miller W T, Cassileth P A. Role of fiberoptic bronchoscopy in the diagnosis of invasive pulmonary aspergillosis in patients with acute leukemia. Am J Med. 1984;76:1027–1034. - PubMed
-
- Arbeit R D, Maslow J N, Mulligan M E. Polymerase chain reaction-mediated genotyping in microbial epidemiology. Clin Infect Dis. 1994;18:1018–1019. - PubMed
-
- Arnow P M, Andersen R L, Mainous P D, Smith E J. Pulmonary aspergillosis during hospital renovation. Am Rev Respir Dis. 1978;118:49–53. - PubMed
Publication types
MeSH terms
Substances
LinkOut - more resources
Full Text Sources
Medical
