. 1998 Jun;180(12):3197-204.
doi: 10.1128/JB.180.12.3197-3204.1998.

Transcriptional regulation of Alcaligenes eutrophus hydrogenase genes

Affiliations

Transcriptional regulation of Alcaligenes eutrophus hydrogenase genes

E Schwartz et al. J Bacteriol. 1998 Jun.

Abstract

Alcaligenes eutrophus H16 produces a soluble hydrogenase (SH) and a membrane-bound hydrogenase (MBH) which catalyze the oxidation of H2, supplying the organism with energy for autotrophic growth. The promoters of the structural genes for the SH and the MBH, PSH and PMBH, respectively, were identified by means of the primer extension technique. Both promoters were active in vivo under hydrogenase-derepressing conditions but directed only low levels of transcription under condition which repressed hydrogenase synthesis. The cellular pools of SH and MBH transcripts under the different growth conditions correlated with the activities of the respective promoters. Also, an immediate and drastic increase in transcript pool levels occurred upon derepression of the hydrogenase system. Both promoters were dependent on the minor sigma factor sigma 54 and on the hydrogenase regulator HoxA in vivo. PSH was stronger than PMBH under both heterotrophic and autotrophic growth conditions. The two promoters were induced at approximately the same rates upon derepression of the hydrogenase system in diauxic cultures. The response regulator HoxA mediated low-level activation of PSH and PMBH in a heterologous system.


Figures
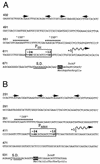
FIG. 1
FIG. 1
Nucleotide sequences of the PSH (A) and the PMBH (B) regions. The start codons of hoxF and hoxK are highlighted, and the deduced N-terminal amino acid sequences are given below the nucleotide sequences. Shine-Dalgarno (S.D.) homologies are underlined. The 5′ ends of in vivo mRNAs determined by primer extension are indicated by wavy lines. The putative PSH and PMBH are boxed, and the conserved dinucleotides of the −24/−12 motifs are emphasized. Sequence elements resembling the consensus E. coli IHF binding site (9, 25) are indicated by asterisks. Palindromic sequence motifs are indicated by pairs of arrows above the sequence. Numbering is based on respective sequence publications (29, 51). A “G” was added to the sequence of the hoxF upstream region between positions 472 and 473 to correct a sequence error. The GenBank entry (accession no. 55230) has been amended accordingly.
FIG. 2
FIG. 2
Comparison of promoter activities, transcript pool sizes, and hydrogenase activities for the SH and the MBH. Single colonies of A. eutrophus H16 or of A. eutrophus H16 harboring the indicator plasmids pGE319 and pGE320 were picked, inoculated into fructose medium, and grown for 15 to 20 h at 35°C. Fresh media were seeded from the precultures to an OD436 of 0.1, and the cultures were grown to the mid-log phase. Samples were taken for determination of β-galactosidase or hydrogenase activity or for preparation of RNA. For heterotrophic cultures, the carbon and energy sources were succinate (SN medium), fructose (FN medium), and a mixture of fructose and glycerol (FGN medium). Autotrophic cultures (H2/CO2) were treated with a mixture of hydrogen, carbon dioxide, and oxygen gases. Specific activities of the hydrogenase enzymes are given as micromoles of product formed per minute per milligram of protein. The values for transcript abundance for the lithoautotrophic cultures were arbitrarily taken as 100%. Bars represent the means of five independent determinations. Except in the case of the transcript determinations, standard errors were too small for graphic representation. Rel., relative.
FIG. 3
FIG. 3
Kinetics of SH and MBH transcript pools following derepression of the hydrogenase system. (A) Relative transcript abundance in diauxic fructose-glycerol-grown cells. (B) Relative transcript abundance in lithoautotrophic cells. Cultures were grown at 30°C and sampled at various intervals. After determination of the OD436, total cellular RNA was isolated from 2-ml samples, and 10 μg each of the resulting RNA samples was added to primer extension reactions containing the specific 32P-labeled primers. After separation in 6% sequencing gels, the radioactive bands were excised and counted in a liquid scintillation counter. Radioactivity (in counts per minute) and cell density (OD436) were plotted against time. Symbols: ○, radioactivity of extension products obtained with the SH-specific primer; ▵ radioactivity of extension products obtained with the MBH-specific primer; □ cell density.
FIG. 4
FIG. 4
Activities of PSH and PMBH in rpoN and hoxA mutants. A. eutrophus H16 and transconjugants harboring plasmids pGE319 (open bars) and pGE320 (closed bars) were grown on FGN medium to an OD436 of 8. Samples were assayed for β-galactosidase activity (see the legend to Fig. 2 for details). Bars represent the means of five independent determinations. Standard errors were too small for graphic representation. wt, wild type.
FIG. 5
FIG. 5
Induction rates for PSH and PMBH during exponential growth on glycerol. A. eutrophus H16 harboring plasmids pGE320 (open circles) and pGE319 (closed circles) was grown on FGN medium. Samples were taken at 30-min intervals from the mid-log-phase cultures and assayed for β-galactosidase activity (see the legend to Fig. 2 for details). Linear regression plots show β-galactosidase activities as a function of OD436. Representative results from two experiments are shown.
FIG. 6
FIG. 6
HoxA-mediated activation of PSH and PMBH in E. coli. E. coli JM109(pCH618/pGE320) and E. coli JM109(pCH618/pGE319) were inoculated into fresh minimal medium containing glycerol and grown at 30°C to an OD600 of 0.3. The cultures were then split, and one duplicate of each was induced by the addition of IPTG to a final concentration of 1 mM (0 h). Samples were taken immediately and thereafter at 2-h intervals for 8 h and assayed for β-galactosidase activity. Final samples were taken at 18 h. Symbols: ○ and • induced cultures; ▿ and ▾ uninduced cultures; • and ▾, JM109(pCH618/pGE320); ○ and ▿, JM109(pCH618/pGE319). The experiment was done twice, with comparable results.

Similar articles

Cited by

References

    1. Amann E, Ochs B, Abel K-J. Tightly regulated tac promoter vectors useful for the expression of unfused and fused proteins in Escherichia coli. Gene. 1988;69:301–315. - PubMed
    1. Ausubel F M, Brent R, Kingston R E, Moore D D, Seidman J G, Smith J A, Struhl K, editors. Current protocols in molecular biology. New York, N.Y: Greene Publishing Associates and Wiley-Interscience; 1987.
    1. Bernhard M, Benelli B, Hochkoeppler A, Zanoni D, Friedrich B. The membrane-bound hydrogenase (MBH) of Alcaligenes eutrophus H16: functional and structural role of the cytochrome b subunit. Eur J Biochem. 1997;248:179–186. - PubMed
    1. Bernhard M, Schwartz E, Rietdorf J, Friedrich B. The Alcaligenes eutrophus membrane-bound hydrogenase gene locus encodes functions involved in maturation and electron transport coupling. J Bacteriol. 1996;178:4522–4529. - PMC - PubMed
    1. Black L K, Maier R J. IHF- and RpoN-dependent regulation of hydrogenase expression in Bradyrhizobium japonicum. Mol Microbiol. 1995;16:405–413. - PubMed

Publication types

MeSH terms

LinkOut - more resources